Ecological Interface Design in Medical Systems
Status: emerging
Last updated: 2026-07-08
Sources: Burns Hajdukiewicz 2004 Ecological Interface Design.Pdf
Tags: [ecological-interface-design, medical, patient-monitoring, anaesthesia, physiological-display, work-domain-analysis, case-study]
Summary
Chapter 8 of Burns & Hajdukiewicz (2004) applies Ecological Interface Design to medical monitoring through three case studies: neonatal oxygenation monitoring, patient monitoring in the operating room, and diabetes self-management. In each case the human body is treated as the work domain and modelled with an Abstraction Hierarchy that runs from physiological purposes down to anatomy, so that measured and derived variables can be organised by their functional role rather than by the sensor that produced them. The designed displays include an integrated neonatal oxygenation display, object and 3D integrated displays for anaesthesia, an auditory (sonification) display, and mobile-device screens for diabetics. Evaluations reported improved diagnostic accuracy and situation awareness relative to conventional single-sensor displays, most so for less experienced clinicians. The chapter also sets out six recurring difficulties of applying EID to biological systems, including where to draw the system boundary and how to handle the medical domain's severe sensor limitations.
Body
Context
Burns & Hajdukiewicz (2004) present medical monitoring as one application domain in their book-length treatment of Ecological Interface Design. Chapter 8 examines how Ecological Interface Design and its central method, Work Domain Analysis (WDA), transfer from process control — for which the Abstraction Hierarchy was developed — to the care of patients. The chapter is organised around three medical settings and a closing discussion of six challenges specific to biological work domains. It sits alongside the KB's other EID material: where Ecological Interface Design gives the general framework and Wda In Design treats the analytical method, this article records how the method was carried out and what displays resulted in medicine. It also connects to Situation Awareness and Data Visualization, because the reported benefits of the medical displays are framed in those terms.
Key Points
The body is modelled as a work domain using the Abstraction Hierarchy. In each case study the patient is treated as the system, decomposed through a Part-Whole Hierarchy of body, system, organ, tissue, and cell, and described at abstraction levels running from physiological purpose (homeostasis) down through balances, processes, physiology, and anatomy (PDF pp. 253–254, orig. pp. 218–219). For neonatal oxygenation, Sharp and Helmicki (1998) built a work domain map of the body systems involved in oxygenation, with homeostasis as the top-level purpose, oxygen/carbon-dioxide balances beneath it, and the ventilation, gas-exchange, circulation, diffusion, and metabolism processes below that (PDF pp. 239–240, orig. pp. 204–205). Causal models were built at the process and balance levels and used to derive the relationships shown on the interface (PDF p. 240, orig. p. 205).
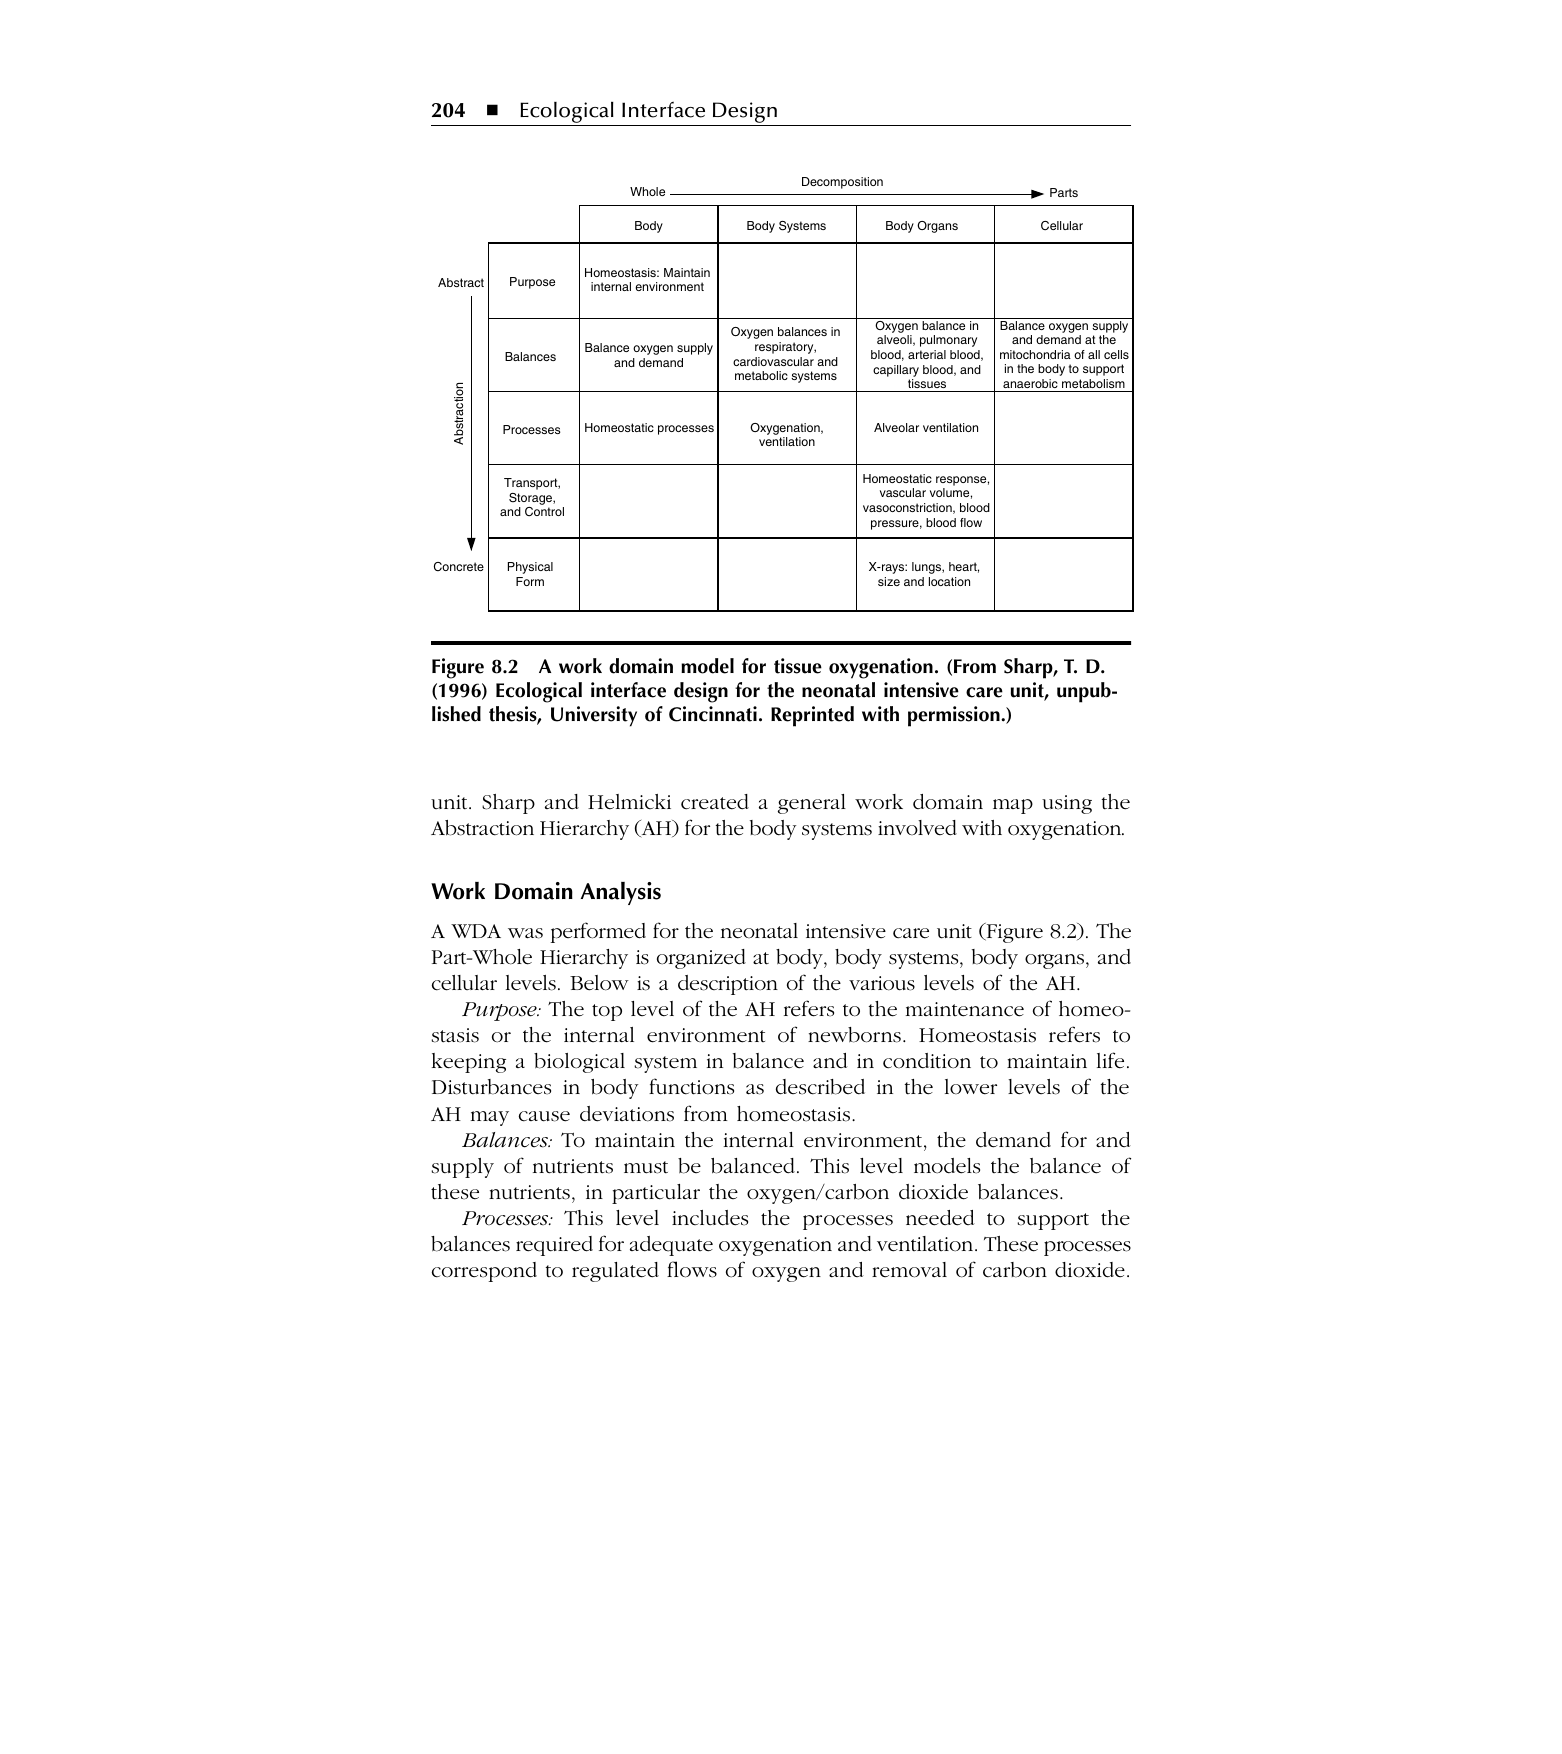
Medical work domains are severely constrained by sensor availability, which the model helps manage. Much of the information identified by a work domain model cannot be sensed, because the required measurement is too invasive or does not exist, and physiological knowledge itself keeps changing (PDF pp. 250–251, orig. pp. 205–206). Sharp and Helmicki (1998) therefore classified variables as directly sensed, analytically derived, heuristically mapped (qualitative estimates agreed with practitioners), or not obtainable at all — for example, inspired oxygen concentration is measured directly, alveolar oxygen partial pressure is derived analytically, ventilation is estimated heuristically from arterial carbon dioxide, and per-cell ATP cannot be obtained in a clinical setting (PDF pp. 251–255, orig. pp. 206–211). Hajdukiewicz et al. (2001) offered a complementary scheme for the operating room describing one-to-one, convergent (many sensors to one variable, for redundancy), divergent (one sensor to many variables, as the ECG signal yields heart rate, rhythm, and myocardial oxygenation), and no mapping (PDF pp. 271–272, orig. pp. 236–237).
The neonatal display organises oxygenation information by its functional role. The designed neonatal intensive-care display mapped work-domain information requirements onto perceptual display forms and laid them out to mirror the balance and process models: the top row of readings corresponds roughly to the balances level and the second row to the processes, with graphs carrying thresholds and a hemoglobin-dissociation background against which values are plotted (PDF pp. 244–245, orig. pp. 209–210). Sharp (1996) noted two limitations — some identified variables had no robust display mapping and were omitted, and practitioners may misread analytically or heuristically mapped values; and target ranges cannot be fixed generically because infant conditions vary so much that clinicians set ranges case by case (PDF pp. 243–244, orig. pp. 208–209).
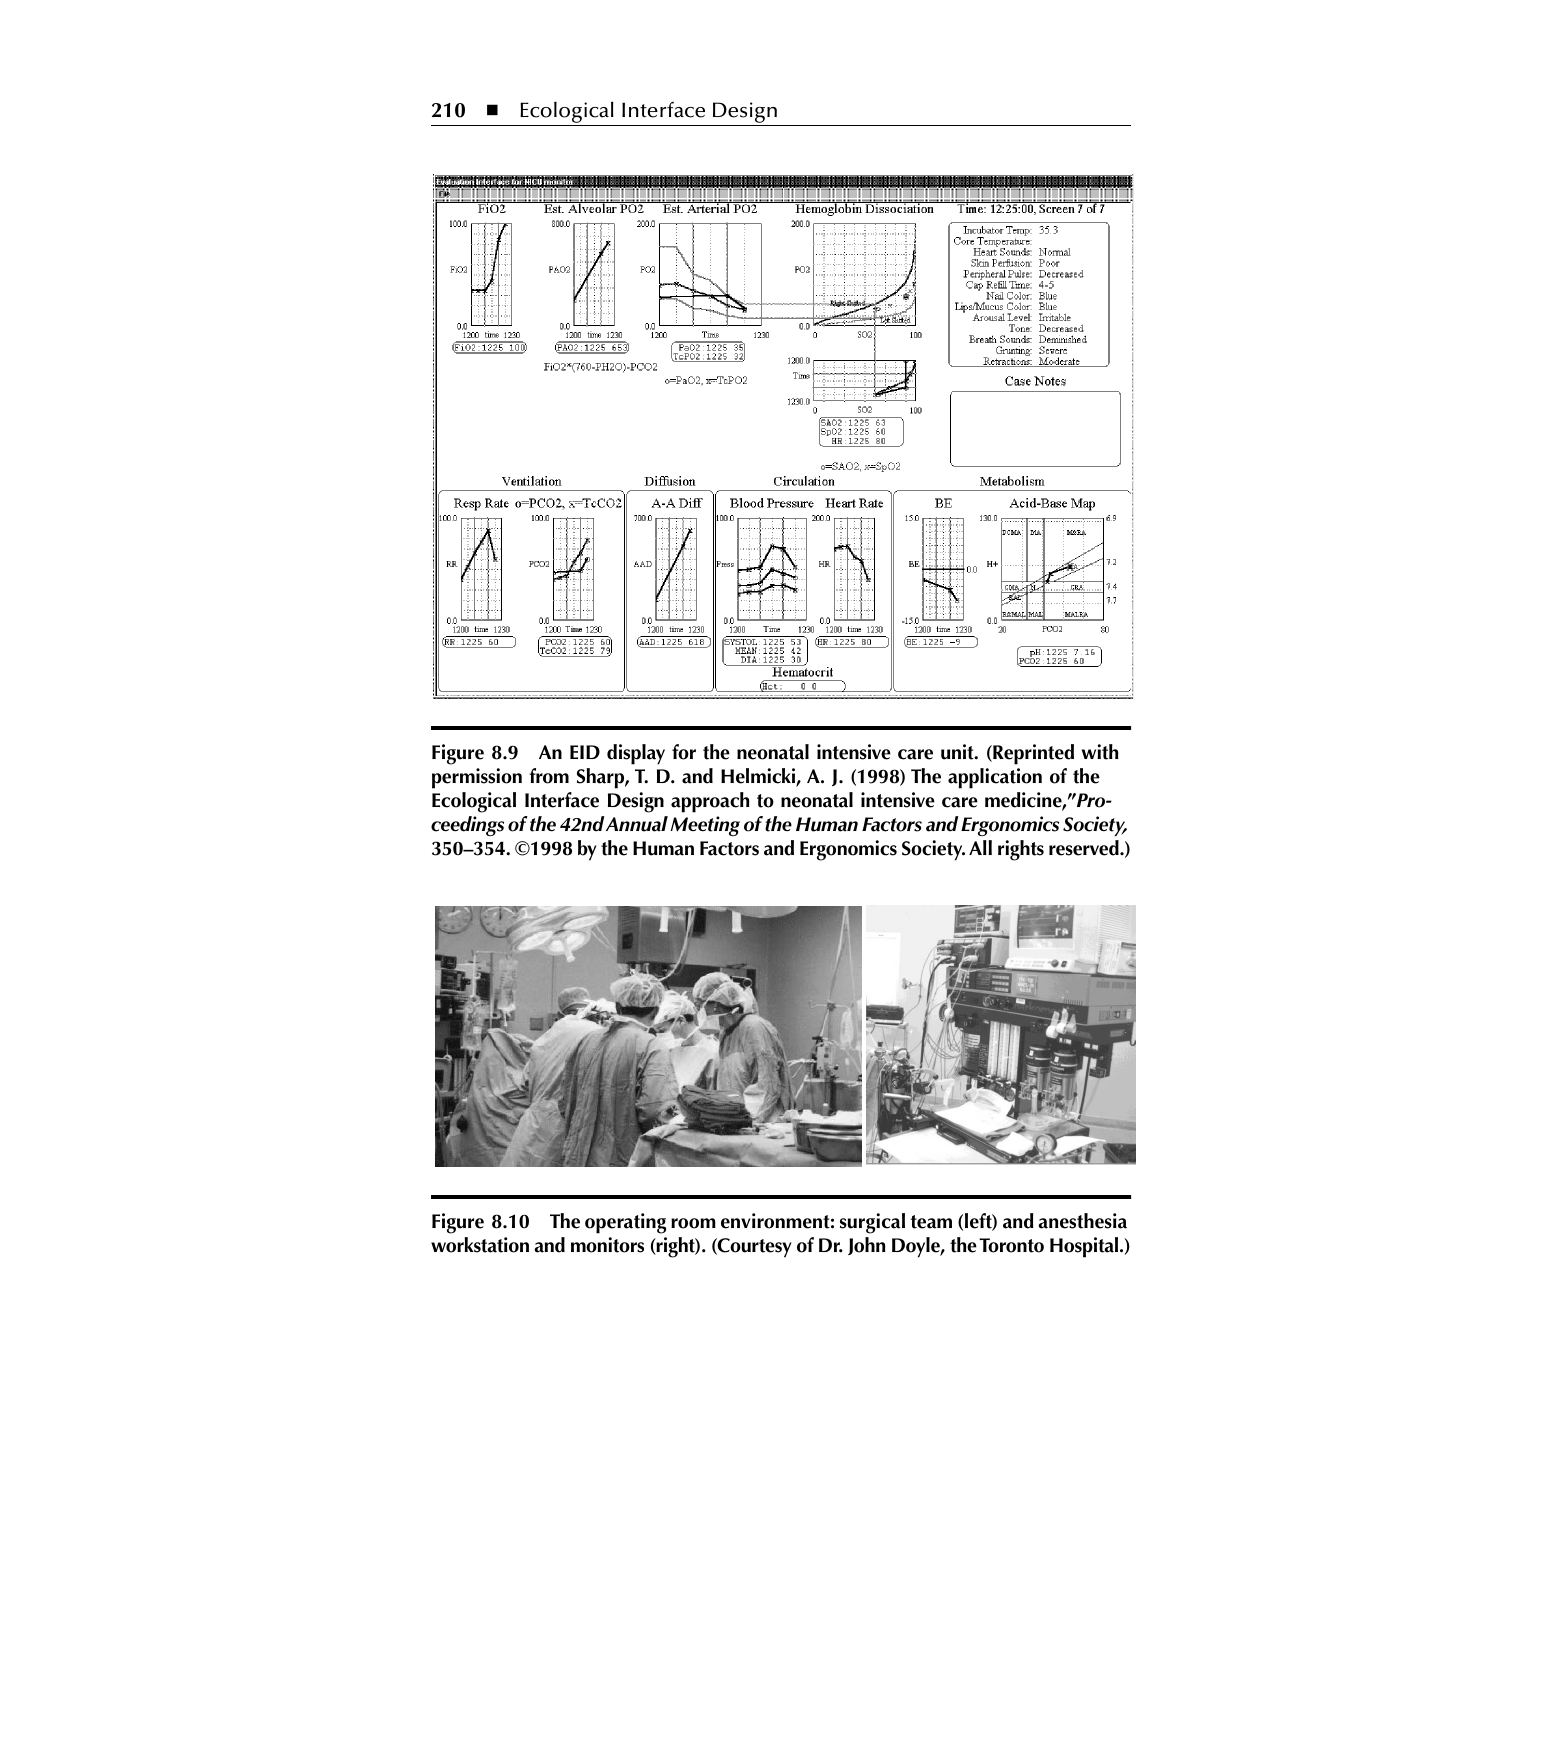
Choosing the system boundary is a deliberate design decision in the operating room. The operating room contains the patient, the equipment, and a team of nurses, surgeon, and anaesthesiologist; the boundary can be drawn around the equipment (for diagnostics), the whole team (for coordination), or the patient (for monitoring), and each choice changes both the scope and the solution (PDF pp. 258–259, orig. pp. 213–214). Hajdukiewicz et al. (1998, 2001) restricted the boundary to the patient and applied the full five-by-five Abstraction Hierarchy, with a partial cardiovascular model showing the greater detail available at lower part-whole levels (PDF pp. 259–261, orig. pp. 214–216). A tighter, equipment-only boundary was illustrated by Sowb et al. (1998), whose ventilation-system analysis excludes the patient and returns to traditional equipment labels such as oxygen and nitrous-oxide supply pressures and flows (PDF p. 262, orig. p. 214).
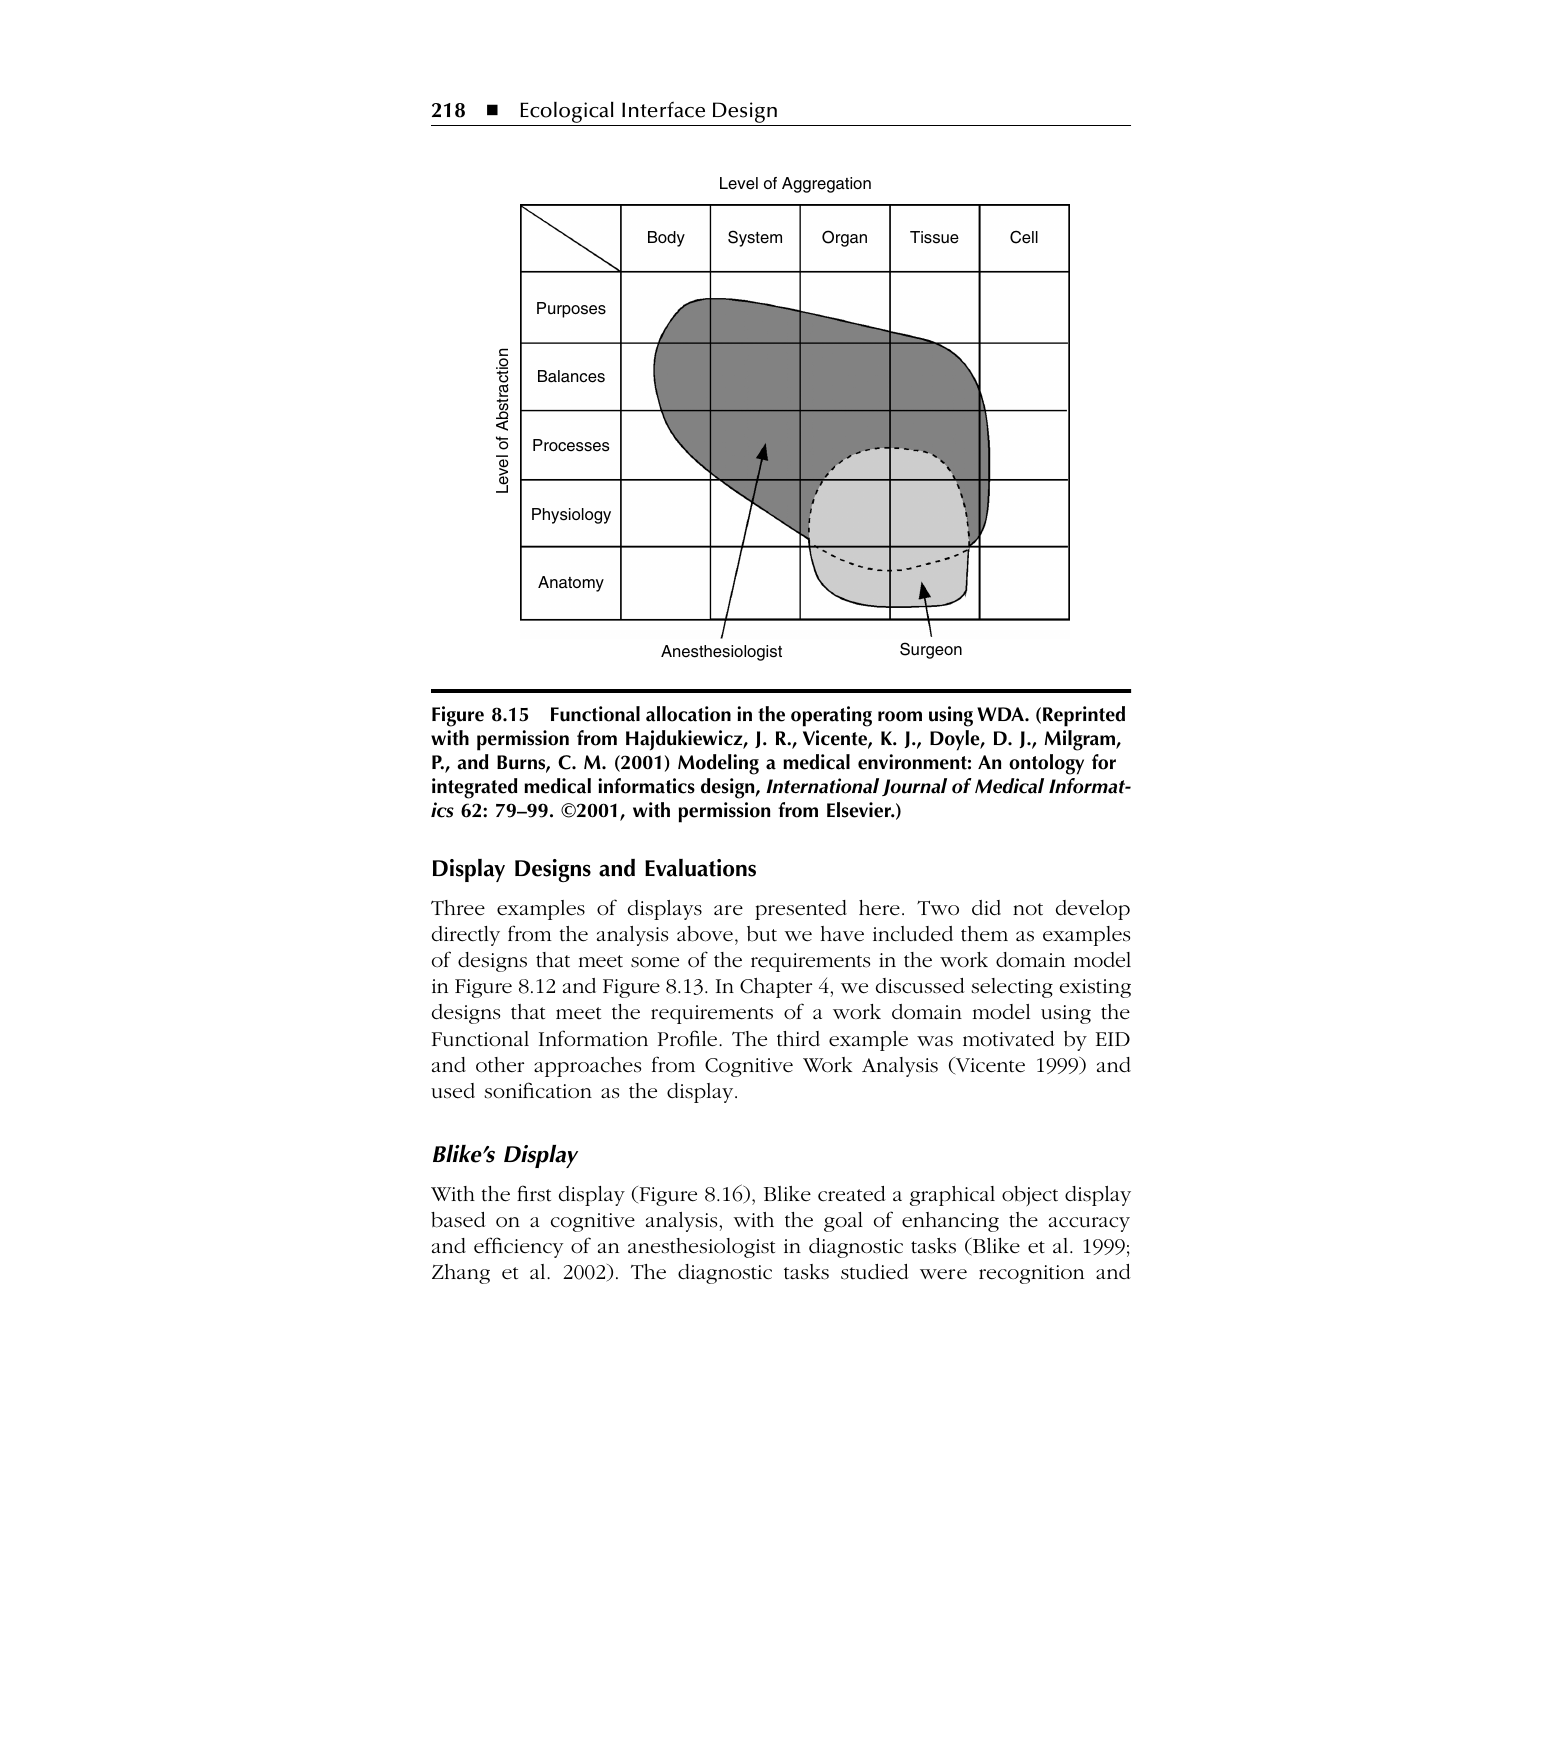
The same patient model supports role-specific function allocation. Because the surgeon and the anaesthesiologist attend to different regions of the patient work domain — the surgeon to organ and tissue function, the anaesthesiologist to maintaining homeostasis and restoring consciousness — the model can allocate functions to roles and indicate where their information needs overlap (PDF pp. 265–266, orig. pp. 217–218). This role mapping suggests distinct ecological displays for each clinician and defines what must be shared to support their coordination (PDF pp. 271–272, orig. pp. 236–237).
Three anaesthesia displays integrate physiological variables graphically and aurally. Blike's object display presents cardiovascular variables — stroke volume, heart rate, oxygen delivery and consumption, and others — with geometric features and connector lines that show relationships derived from cardiovascular causal models, so that, for instance, the line between oxygen delivery and consumption reads horizontal when the two are balanced (PDF pp. 266–268, orig. pp. 219–221). Evaluations by Blike et al. (1999, 2000) found faster and more accurate recognition of cardiac events and improved situation awareness at the medium level in one of four scenarios (PDF pp. 268–269, orig. pp. 220–221). The 3D integrated display of Zhang et al. (2002) shows eight real-time variables from front, side, and top angles against reference grids, animating a cardiac object whose height tracks cardiac volume and whose width tracks heart-beat period; reliable differences favoured it in 63% of simulated scenarios (PDF pp. 269–271, orig. pp. 221–223). A third approach applied EID to sound: Watson et al. (1999, 2000), extending WDA with the further stages of Cognitive Work Analysis and an attentional-mapping stage proposed by Sanderson et al. (2000), used two-stream, five-variable sonification that improved monitoring and reduced interference with a concurrent task for trained anaesthesiologists (PDF pp. 271–272, orig. pp. 224–225).
The diabetes case extends EID to a self-managed, mobile domain. For diabetes the work domain comprises the patient, food, and insulin, with the patient acting as one of the system's controllers — a boundary problem the authors resolve by treating that control as part of the domain's processes (PDF pp. 272–273, orig. pp. 225–226; PDF pp. 268–269, orig. pp. 233–234). The domain was modelled with two functional purposes, maintaining blood glucose in range and maintaining body weight, over an energy-balance layer and detailed glucose processes, decomposed only to the organ level because finer decomposition exceeds what can be measured (PDF pp. 260–265, orig. pp. 225–230; PDF pp. 268–269, orig. pp. 234–235). The resulting EID screens were built for cellphones and PDAs, using status icons, threshold graphs, stacked bar graphs with connecting lines for balances, and scatterplots of glucose over time, demonstrating that ecological display ideas scale to small screens; this project remained under development, awaiting a randomised controlled trial (PDF pp. 265–268, orig. pp. 228–233).
Conclusion
The medical case studies show that EID can be applied to the human body once it is treated as a work domain and modelled with an Abstraction Hierarchy, even though biological systems resist clean boundaries, can be decomposed indefinitely, and are poorly instrumented. Across neonatal care, anaesthesia, and diabetes, displays built on or mappable to work domain models organised physiological information by function and, where tested, improved diagnostic accuracy and situation awareness relative to single-sensor displays, with the largest gains for less experienced clinicians. The work domain model served not only to design displays but also to allocate functions between roles and to guide where scarce sensors should be placed.
Related
- Ecological Interface Design
- Work Domain Analysis
- Wda In Design
- Situation Awareness
- Data Visualization
- Representation Design
References
Blike, G. et al. (1999, 2000) Studies of a graphical object display for anaesthesia diagnosis and situation awareness. To be validated.
Burns, C.M. & Hajdukiewicz, J.R. (2004) Ecological Interface Design. Boca Raton, FL: CRC Press. burns2004ecological
Hajdukiewicz, J.R., Doyle, D.J., Milgram, P., Vicente, K.J. & Burns, C.M. (1998) A work domain analysis of patient monitoring in the operating room. Proceedings of the 44th Annual Meeting of the Human Factors and Ergonomics Society, 1034–1042. To be validated.
Hajdukiewicz, J.R., Vicente, K.J., Doyle, D.J., Milgram, P. & Burns, C.M. (2001) Modeling a medical environment: An ontology for integrated medical informatics design. International Journal of Medical Informatics 62: 79–99. To be validated.
Sanderson, P. et al. (2000) Proposed extension of EID to auditory display design. To be validated.
Sharp, T.D. (1996) Ecological interface design for the neonatal intensive care unit. Unpublished thesis, University of Cincinnati. To be validated.
Sharp, T.D. & Helmicki, A.J. (1998) The application of the Ecological Interface Design approach to neonatal intensive care medicine. Proceedings of the 42nd Annual Meeting of the Human Factors and Ergonomics Society, 350–354. To be validated.
Sowb, Y.A., Loeb, R.G. & Roth, E.M. (1998) Cognitive modeling of intraoperative critical events. Proceedings of the IEEE Meeting on Systems, Man, and Cybernetics, 2532–2538. To be validated.
Watson, M. et al. (1999, 2000) Two-stream, five-variable sonification for anaesthesia monitoring. To be validated.
Zhang, Y., Drews, F.A., Westenskow, D.R., Forest, S., Agutter, J., Bermudez, J.C., Blike, G. & Loeb, R. (2002) Effects of integrated graphical displays on situation awareness in anaesthesiology. Cognition, Technology & Work 4: 82–90. To be validated.
Open Questions
- The neonatal and anaesthesia displays were evaluated in simulated or static scenarios; the chapter does not report on their use in continuous live clinical practice, so their effect on real-world patient outcomes is unstated.
- Analytically and heuristically mapped variables carry uncertainty that clinicians may not perceive; how such derived values should be flagged on the interface is left open.
- The diabetes mobile displays awaited a randomised controlled trial at the time of writing, so their effectiveness for patient self-management is not yet established here.