Using a Work Domain Model in Design
Status: emerging
Last updated: 2026-07-08
Sources: Burns Hajdukiewicz 2004 Ecological Interface Design.Pdf
Tags: [ecological-interface-design, work-domain-analysis, display-design, design-process, interface-design]
Summary
Chapter 4 of Ecological Interface Design sets out a method for turning a work domain model into display graphics. The abstraction hierarchy is read in four passes that extract, in order, information requirements, single-variable constraints, multivariate constraints, and means-end relationships. Each pass feeds a corresponding design decision: what content to show, how to bound and contextualise it, how to combine variables into configural forms, and how to organise and rank the resulting graphics. The chapter works a single running example, a car, through four design stages that mirror these passes. The result is a reproducible route from an abstraction hierarchy to a laid-out, integrated ecological display.
Body
Context
Burns & Hajdukiewicz (2004) devote Chapter 4 to the join between analysis and representation. It assumes a completed work domain model from the abstraction-hierarchy method (see Work Domain Analysis) and the graphic vocabulary of single-variable and configural forms (see Interface Design Language), and shows how one produces the other. The chapter therefore operationalises Ecological Interface Design: it converts an account of domain constraints into perceptual forms a user can read directly, rather than leaving the mapping to designer intuition.
Key Points
A systematic route from analysis to graphics. The design method treats the work domain analysis as the source of four kinds of information, each extracted in a separate pass and each driving a distinct part of graphic form design (PDF pp. 121, 139; orig. pp. 86, 104). The overall pipeline runs from domain knowledge, through work domain analysis, through the four extraction passes, to graphic form design.
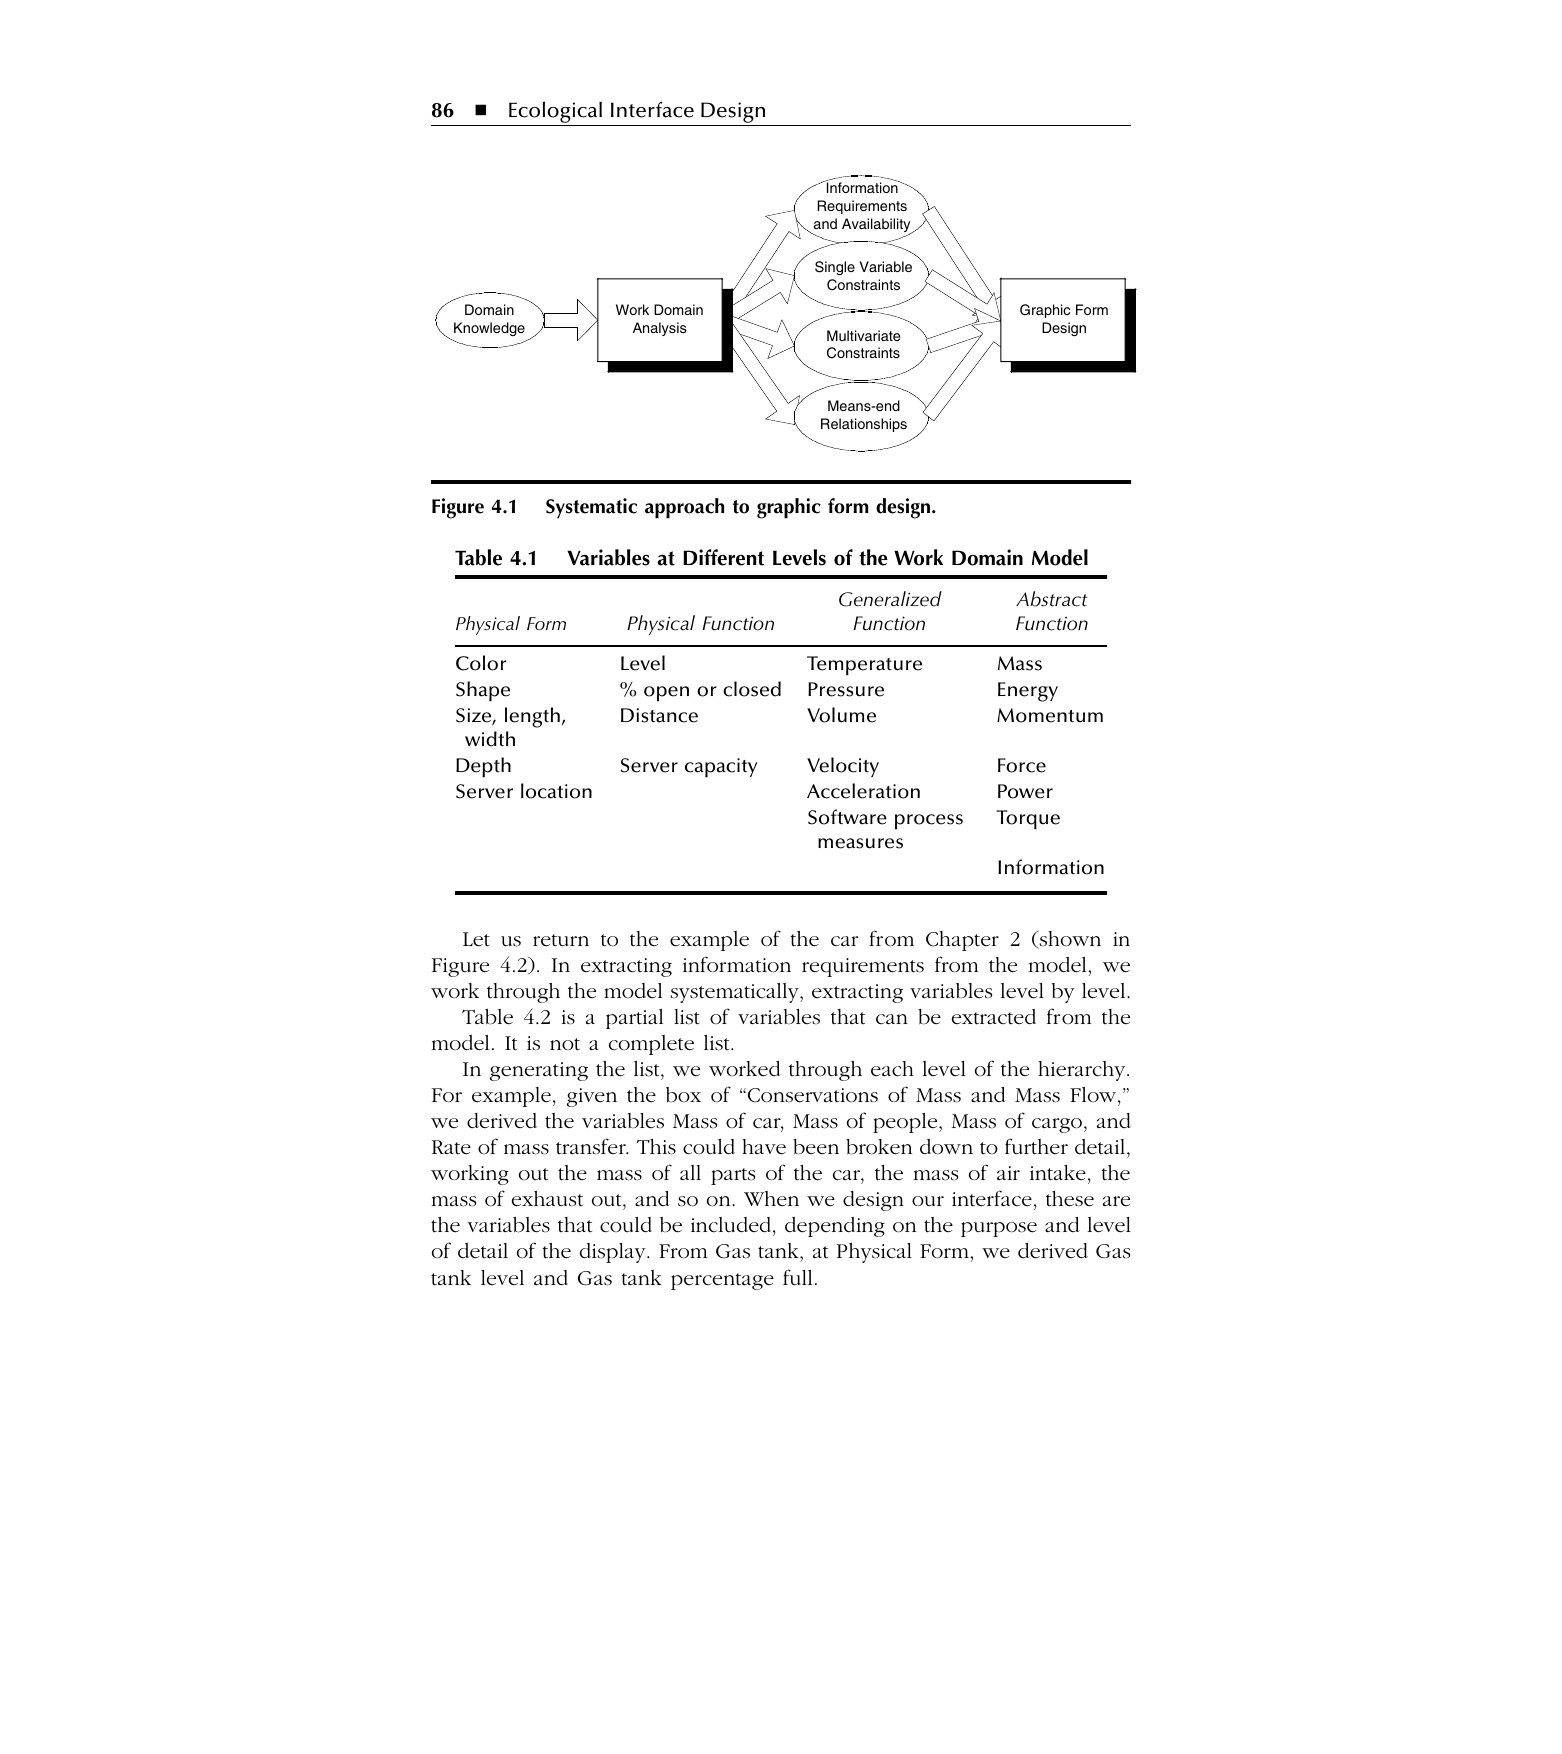
Pass one: information requirements. The first pass converts the model into a list of variables, worked box by box and level by level, asking of each element "How could we measure that?" (PDF pp. 120, 123; orig. pp. 85, 88). Different levels invite different measures: overall performance at Functional Purpose; flows, balances, and conservation at Abstract Function; process variables such as temperature and pressure at Generalized Function; capacity and equipment state at Physical Function; and physical attributes such as size, colour, and material at Physical Form (PDF pp. 123–124; orig. pp. 88–89).
Record requirements regardless of current sensing. Requirements are to be listed without regard to whether a variable can currently be measured, because ecological design must reflect how the environment actually works; unmeasured quantities get a placeholder for later refinement (PDF p. 124; orig. p. 89). A separate information availability analysis then classifies each variable as sensed, calculated from sensor data, not currently measured, or calculable in principle, citing Dinadis and Vicente (1999) and Moradi-Nadimian et al. (2002) (PDF p. 125; orig. p. 90). This can yield two design drafts, one for the current sensor set and one for an improved set (PDF p. 125; orig. p. 90).
Pass two: single-variable constraints. A second pass asks "How much?", "How quickly?", and "Is there a limit?" to record maxima, minima, and thresholds for each variable (PDF pp. 126–127; orig. pp. 91–92). These constraints supply context: they set scale ranges, alarm limits, important thresholds, background lines and profiles, and visual coding schemes, so a reading is interpreted against what counts as high, low, good, or bad (PDF pp. 127–128; orig. pp. 92–93).
Pass three: multivariate constraints. A third pass looks for relationships among two or more variables, often expressed as equations such as conservation laws of the form In − Out = Stored, which may sit at one level or cross levels (PDF pp. 128–129; orig. pp. 93–94). Relationships that cross levels are the most informative because they show how lower-level elements work toward higher-level purposes. These constraints are the basis for configural displays, including additive or multiplicative forms, empirically grounded backgrounds, and the polar-star form when no governing equation exists; showing them reduces the mental workload of calculation and look-up (PDF pp. 129–130; orig. pp. 94–95).
Pass four: means-end relationships. The final pass reads the means-end links joining elements across levels, producing a chain in which each element is implicated in the value of another (for example, gas tank capacity determines stored fuel, which determines available energy, which determines whether people can be transported) (PDF p. 130; orig. p. 95). Even where no equation exists, these links are shown because they let a user work toward system purpose and diagnose faults; they also guide how graphics are grouped and how salience is assigned (PDF pp. 130–131; orig. pp. 95–96).
A four-stage worked design. The chapter demonstrates the four passes as four cumulative design stages on the car's fuel system (PDF pp. 131–135; orig. pp. 96–100). Stage 1 renders every requirement as a basic graphic, typically meters or bar graphs, laid out to follow the process flow. Stage 2 enriches each graphic with threshold lines, alarm limits, and normal-range shading, and collapses redundant variables (distance travelled versus distance to destination becomes one percentage bar). Stage 3 links related variables: an energy-balance line that runs horizontal when inputs and outputs match, a distance-time graphic that reads vertical at expected speed, and a shrinking fuel-range circle. Stage 4 reviews the model to organise the layout, placing Functional Purpose graphics top-left, enlarging them for salience, arranging process graphics top-to-bottom by abstraction level and left-to-right by process flow, and shading between levels to show means-end connections (PDF pp. 135–136; orig. pp. 100–101).
Organise by level and rank by salience. The organising principle is that users normally monitor at the highest level, Functional Purpose, and descend only when problems arise; therefore highest-level graphics are made largest and most salient and placed to be read first, while lower-level diagnostic graphics are reduced in size and lightened, remaining available for fault-finding (PDF pp. 135–136; orig. pp. 100–101).
Assessing existing displays. For situations without a clean-sheet design, a functional information profile maps an existing display against the work domain model to show which levels are covered and which are not; a standard car dashboard, for instance, informs mainly at Generalized and possibly Physical Function, leaving other levels open to improvement (PDF pp. 136–137; orig. pp. 102–103).
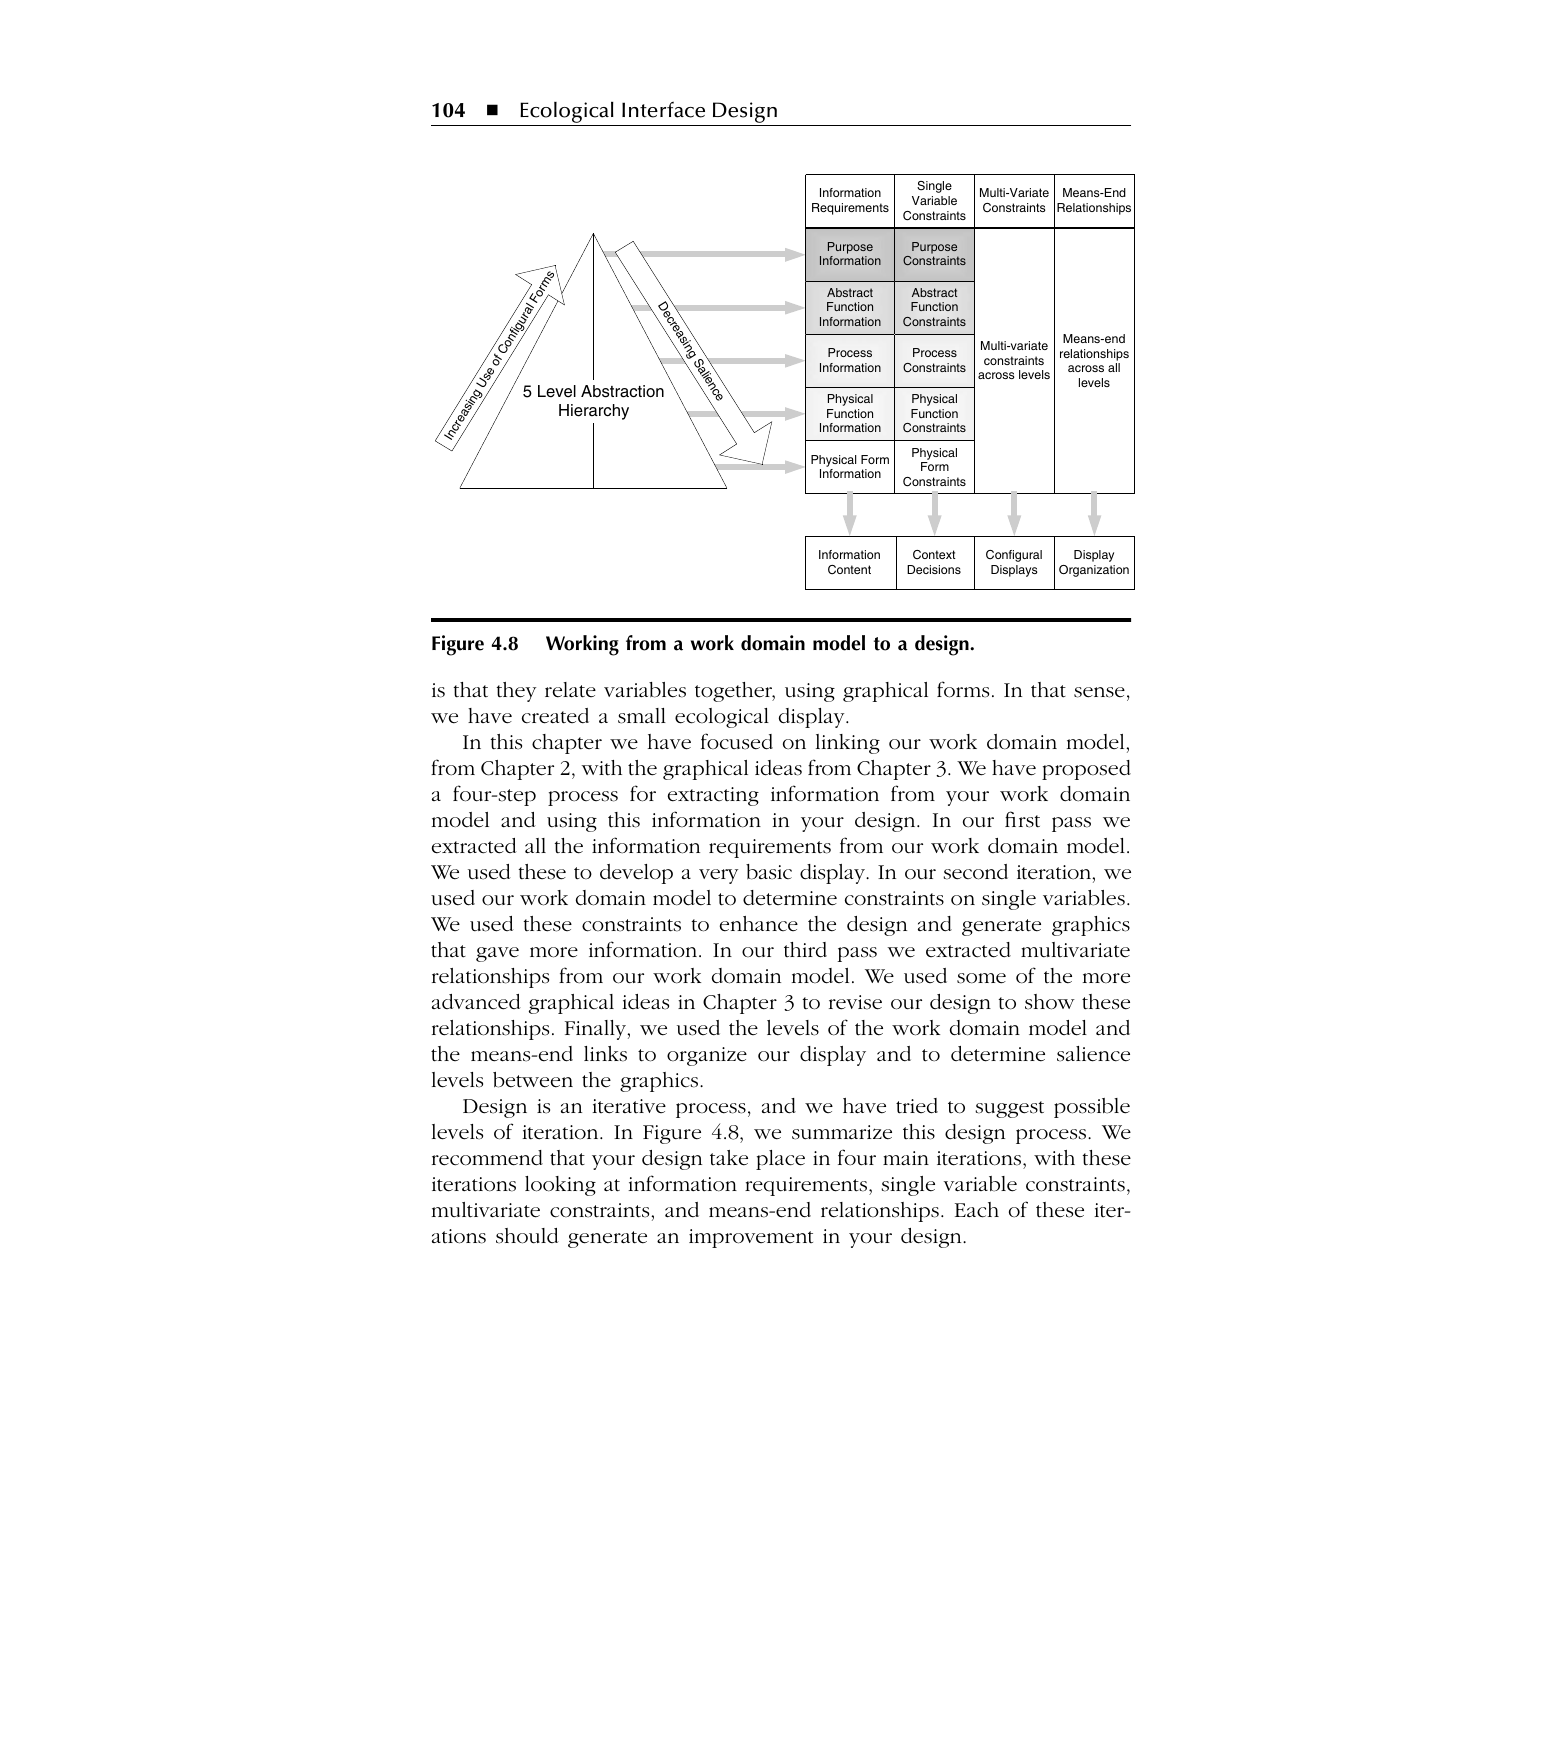
The consolidated process. The four passes and their outputs are summarised as one figure: reading the five-level hierarchy against columns of information requirements and constraints, with configural forms increasing and salience decreasing down the levels, and the bottom row naming the four design decisions of information content, context, configural displays, and display organisation (PDF p. 139; orig. p. 104).
Conclusion
The chapter supplies a repeatable procedure for translating domain constraints into perceptual forms: four ordered passes over the abstraction hierarchy that extract requirements, single-variable constraints, multivariate constraints, and means-end relationships, each feeding a matching design decision. Framing design as four iterations lets work begin early and defers the hardest configural forms until the designer understands the domain best, while the level-based salience scheme keeps everyday monitoring at the level of purpose and detail available on demand.
Related
References
Burns, C.M. & Hajdukiewicz, J.R. (2004) Ecological Interface Design. Boca Raton, FL: CRC Press. burns2004ecological
Dinadis, N. & Vicente, K.J. (1999) 'Designing functional visualizations for aircraft systems status displays'. The International Journal of Aviation Psychology. To be validated (cited in Burns & Hajdukiewicz 2004; not held in RAW).
Moradi-Nadimian, R. et al. (2002). To be validated (cited in Burns & Hajdukiewicz 2004; full reference not given in the chapter and not held in RAW).
Open Questions
- How is the ordering of the four passes affected when a domain has few available sensors, so that many requirements remain placeholders?
- What criteria decide when a multivariate relationship warrants a configural form versus separate single-variable graphics with a linking cue?
- How does the functional information profile scale to complex multi-screen displays where coverage is distributed rather than held on one view?