Ecological Interface Design in Process Control Systems
Status: emerging
Last updated: 2026-07-08
Sources: Burns Hajdukiewicz 2004 Ecological Interface Design.Pdf
Tags: [ecological-interface-design, process-control, nuclear-power, abnormal-situation-management, mass-energy-balance, display-design, case-study]
Summary
Process control covers systems that convert or move mass and energy under tight, continuous control, such as thermal and nuclear power generation, petrochemical reactors, and oil refining. Chapter 6 of Ecological Interface Design presents six worked case studies in which Ecological Interface Design (EID) was applied to systems of increasing scale, from an 11-component pasteurizer to the thousand-plus-component Syncrude refinery. Each case shows how a Work Domain Analysis based on mass-and-energy relations was translated into configural graphics such as mass and energy balance displays, rankine-cycle plots, and triangle graphics derived from the DURESS microworld. The chapter is organized around five recurring challenges: sensor availability, part-whole representation at scale, choice of modeling technique, information organization on the display, and integrating task analysis with domain analysis. Empirical evaluations across the cases show faster fault diagnosis and more accurate diagnosis with ecological displays, subject to adequate instrumentation.
Body
Context
This article draws on Burns & Hajdukiewicz (2004), Chapter 6, which examines process control as an application domain for EID. Process control is where the approach originated: the foundational work by Rasmussen and Vicente at the Risø National Laboratory used process plants as its testbed, and the DURESS feedwater-control simulation underpins much of the empirical basis for EID (PDF pp. 176–177, orig. pp. 141–142). Chapter 6 extends the concepts developed from the small-scale DURESS example to larger, real-world systems. It sits alongside the general method in Ecological Interface Design and the analytic front end in Work Domain Analysis; the case studies show how that analysis is carried through to deployed displays. Process control systems are characterized by mass and energy relations and by the physics and chemistry of the processes they run; total automation has not been feasible at their scale, so operator monitoring and intervention remain necessary. Failures remain costly, with one estimate of $10 billion lost per year in the United States alone (Nimmo 1995, cited in Burns & Hajdukiewicz 2004) (PDF p. 176, orig. p. 141).
Key Points
Thermal power generation: the integration question.
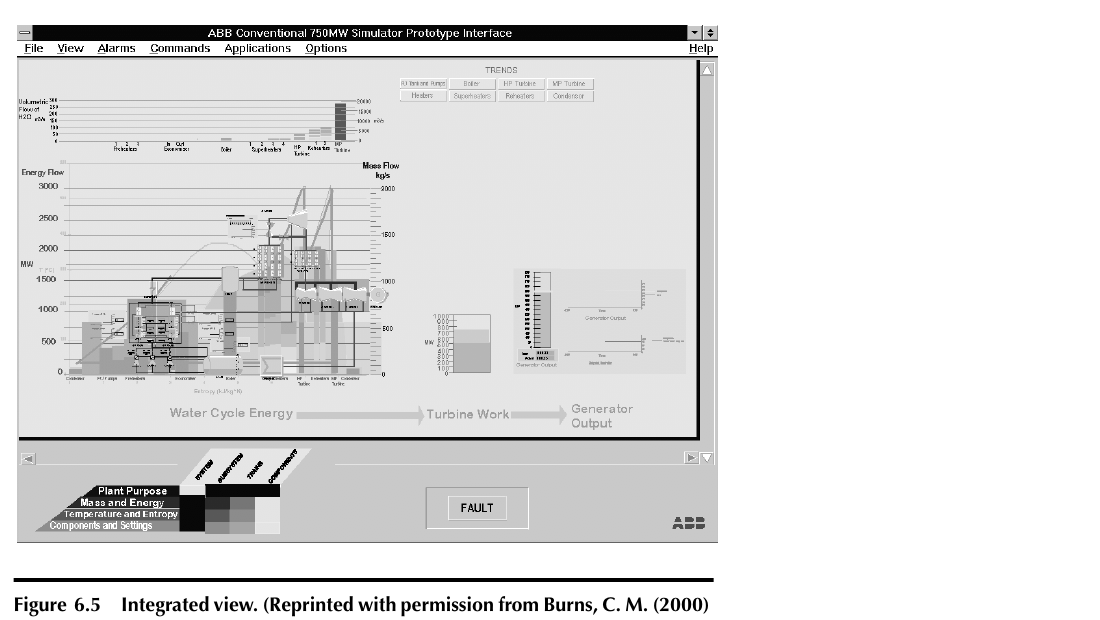
The first case designed ecological displays for a simulated coal-fired thermal generating plant containing 402 sensed variables (PDF pp. 178–179, orig. pp. 143–144). The Work Domain Analysis modeled four levels, identifying mass and energy relations at the Abstract Function level and a water-to-steam rankine cycle at the Generalized Function level. The design question was how to distribute this multi-level information: across separate screens, into separate windows on one screen, or integrated into a single tightly organized display (PDF pp. 179–181, orig. pp. 144–146). The integrated display combines an Abstract Function mass-and-energy bar graph, a Generalized Function rankine-cycle configural plot (first proposed by Beltracchi 1989, 1995, and evaluated by Vicente et al. 1996), and iconic tank and heater graphics that fill as the components fill (PDF p. 181, orig. p. 146). Evaluation with engineering students found slower fault detection but faster and more accurate fault diagnosis with the integrated display, and generally poorer results plus higher workload with the windowed display (Burns 2000; Burns et al. 2002) (PDF p. 181, orig. p. 146).
Nuclear power: energy balance made visible.
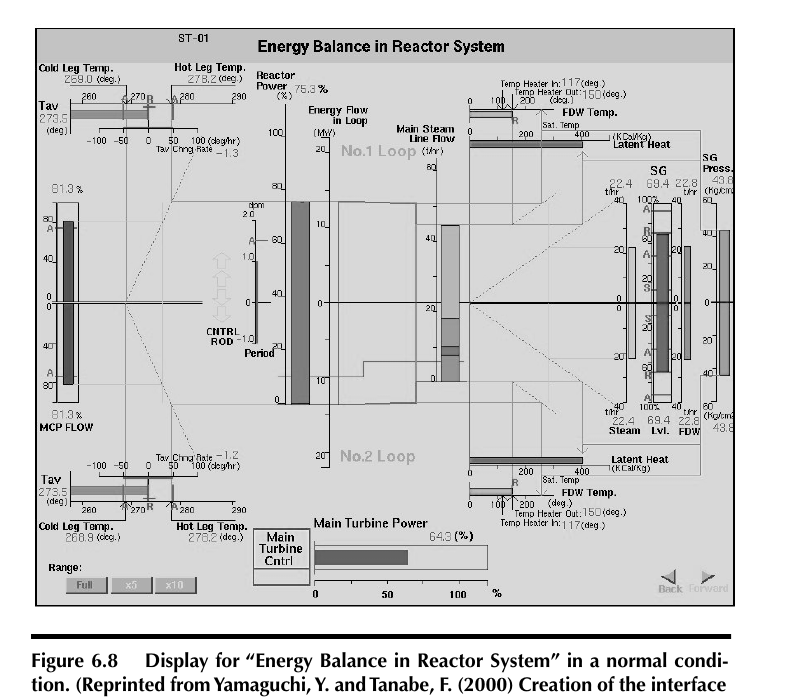
Yamaguchi and Tanabe (2002) applied EID to an engineering simulator of the two-loop pressurized water reactor on the nuclear ship Mutsu, a 36 MW core (PDF p. 182, orig. p. 147). Five higher-level displays were built, including Energy Balance in Reactor System, Mass Balance in Primary System, and a P-T diagram. In the energy balance display, a central rectangle encodes energy transfer from the reactor loop to the main steam line: the height of its left edge shows energy in the reactor loop and the height of its right edge shows energy transferred to the second loop. Under normal conditions these are balanced, and in an abnormal condition the rectangle becomes visibly asymmetric because more energy is being produced than transferred (PDF pp. 186–187, orig. pp. 151–152). Triangle graphics, influenced by the DURESS graphic from Chapter 1, encode mass and energy relationships. Preliminary assessment in a full-scope simulator reported considerably improved control performance in normal operation and better overall situational context from the higher-level information (PDF p. 186, orig. p. 151).
Pasteurizer: matching sensors to ecological displays.
Reising and Sanderson (2002a) rebuilt a pasteurizer microworld with EID displays and used it to study how instrumentation configuration affects highly configural displays (PDF pp. 187–189, orig. pp. 152–154). The system heats milk to a target temperature range held for 15 seconds to be legally pasteurized (Hall and Trout 1968, cited in Reising and Sanderson 2002a). Their Abstraction Hierarchy used level labels differing from the standard set, notably a Priorities/Values level (equivalent to Abstract Function, modeling mass balance, energy balance, and regulatory compliance) and an Object-Related Processes level, and it embedded part-whole nodes directly inside aggregate elements (PDF pp. 189–190, orig. pp. 154–155). The system was run at two sensor levels, a maximum configuration (36 sensors) and a minimum configuration (13 sensors) (PDF p. 191, orig. p. 156). The ecological interface supported better fault diagnosis, but only when supported with adequate instrumentation; more correct diagnoses occurred in the high-sensor condition for both interfaces, while control performance was unaffected by interface or sensor level (PDF pp. 193–194, orig. pp. 158–159). The energy display was rated important for reaching higher performance.
Acetylene hydrogenation reactor: multiple modeling techniques and task analysis.
This petrochemical case analyzed a reactor within an ethylene facility whose purpose is to convert acetylene to ethylene down to a target of less than 5 ppm (Miller and Vicente 1998; Jamieson 2002) (PDF p. 194, orig. p. 159). The Part-Whole Hierarchy used three levels (reactor, units, components) and the Abstraction Hierarchy used five levels with both functional and causal models (PDF pp. 194–195, orig. pp. 159–160). At the Abstract Function level the designers separated mass flows from energy flows and expressed them with Multilevel Flow Modeling, a functional modeling approach using primitives of source, sink, transfer, barrier, and transport (Lind 1990, 1991, 1994) (PDF pp. 195–196, orig. pp. 160–161). Miller and Vicente (1998, 2001) also performed a Hierarchical Task Analysis; Jamieson (2002) used it to build an EID+Task display that carried both domain and task information (PDF pp. 199–200, orig. pp. 164–165). In an evaluation with 30 professional operators (mean 3.6 years experience), trial completion times were fastest with the EID+Task display, followed by the EID display and then the current display, and operators made more correct fault diagnoses with the EID+Task display than with either alternative (PDF pp. 203–204, orig. pp. 168–169).
Large refinery: organizing analysis at scale.
The Syncrude extraction and upgrading facility in Ft. McMurray was among the first large plants to implement EID; the analysis alone took seven analysts a year (PDF pp. 204–205, orig. pp. 169–170). The project began with an explicit Part-Whole Analysis running to hundreds of separate decompositions across overall plant, individual plants, plant sections, and sections, with a full Abstraction Hierarchy built at each level (PDF pp. 205–206, orig. pp. 170–171). The traditional Abstraction Hierarchy labels were renamed Purposes, Principles, Processes, and Components to improve communication with plant engineers, and mass and energy structures were modeled separately at the Principles level because heating, cooling, and exothermic reactions gave them different structures (PDF p. 206, orig. p. 171). An overview reactor concept normalizes reactor temperatures into a vertical reference line, reports catalyst level via a bar graph, and connects Generalized Function variables (temperature, feed rate, catalyst addition rate) to Functional Purpose requirements through small graphs with shaded optimal-performance regions (PDF pp. 207–208, orig. pp. 172–173).
Handling the five challenges.
The chapter closes by consolidating the cases into guidance (PDF pp. 208–213, orig. pp. 173–178). Sensor availability: a full sensor set improves diagnostic performance with ecological interfaces, and WDA can guide sensor placement; indicating sensed versus derived values in the interface may help. Part-whole representation scales with project size, from implicit analysis integrated with the abstract dimension (0–20 components, pasteurizer), through a single explicit hierarchy (20–1000 components, thermal and acetylene), to multiple hierarchies used as an organizing tool (1000+ components, Syncrude). Modeling technique: functional models portray means-end links most directly, causal models are added as flow patterns grow complex, and Multilevel Flow Models help where mass and energy flows differ, as in heat-exchange systems. Information organization follows two principles, making means-end links apparent and encouraging monitoring at higher abstraction levels while reserving concrete levels for control, implemented either as a top-to-bottom, left-to-right abstract-to-concrete flow or as separate overview and control screens. Task analysis, finally, supplies limits, thresholds, and operating points that WDA alone does not, obtained through Hierarchical, Cognitive, or Control Task Analyses or from operating procedures.
Conclusion
Chapter 6 demonstrates that a single design philosophy scales from an 11-component microworld to one of the world's largest refineries, provided the analyst adapts the mechanics of Work Domain Analysis to the system's size and flow complexity. The recurring output is the same across domains: configural graphics that render mass and energy balances directly perceivable, so that operators can monitor at high abstraction levels and act at concrete ones. The evaluations reported here favor ecological and EID+Task displays for fault diagnosis, while also establishing that this advantage depends on adequate instrumentation.
Related
References
Beltracchi, L. (1989; 1995) Rankine cycle display work for process control. To be validated.
Burns, C.M. (2000) Putting it all together: improving display integration in ecological displays. Human Factors, 42, 226–241. To be validated.
Burns, C.M. & Hajdukiewicz, J.R. (2004) Ecological Interface Design. Boca Raton, FL: CRC Press. burns2004ecological
Hall, C.W. & Trout, G.M. (1968) Milk pasteurization. To be validated.
Jamieson, G.A. (2002) Empirical evaluation of an industrial application of Ecological Interface Design. Proceedings of the 46th Annual Meeting of the Human Factors and Ergonomics Society, 536–540. To be validated.
Lind, M. (1990; 1991; 1994) Multilevel Flow Modeling. To be validated.
Miller, C.A. & Vicente, K.J. (1998; 2001) Abstraction decomposition space analysis for NOVA's E1 acetylene hydrogenation reactor. Cognitive Engineering Laboratory, University of Toronto. To be validated.
Nimmo, I. (1995) Abnormal situation management and the cost of process incidents. To be validated.
Reising, D.V.C. & Sanderson, P. (2002a) Ecological interface design for Pasteurizer II: a process description of semantic mapping. Human Factors, 44(2). To be validated.
Vicente, K.J., Christoffersen, K. & Pereklita, A. (1996) Supporting operator problem solving through ecological interface design. To be validated.
Yamaguchi, Y. & Tanabe, F. (2002) Creation of the interface system for nuclear reactor operation: practical implication of implementing EID concept on a large complex system. To be validated.
Open Questions
- Reising and Sanderson show sensor availability constrains the diagnostic benefit of ecological displays, but the chapter notes no one has yet studied the effects of sensor noise or information uncertainty on ecological interfaces (PDF p. 209, orig. p. 174). How should EID displays represent uncertain or derived values?
- Several of the largest deployments (Syncrude, and to some extent the fluid catalytic cracking unit) had no evaluation results at the time of writing. Do the diagnosis advantages seen in simulator studies transfer to production control rooms at full scale?
- The pasteurizer case used a non-standard Abstraction Hierarchy (Priorities/Values, Object-Related Processes); the authors expect no significant display differences from such analytic variations. Under what conditions, if any, would alternative level definitions change the resulting display?