The Language of Interface Design
Status: emerging
Last updated: 2026-07-08
Sources: Burns Hajdukiewicz 2004 Ecological Interface Design.Pdf
Tags: [interface-design, display-design, visual-thesaurus, configural-displays, representation-design, ecological-interface-design]
Summary
Chapter 3 of Burns & Hajdukiewicz (2004) sets out a shared vocabulary for describing and building interfaces before any display is drawn. It organises interfaces as a nested hierarchy of designed objects (pixels through workspaces), names three forms of reference for data (propositional, iconic, analogical), and contrasts analog and digital graphic forms alongside the design of context and salience. Its central contribution is a "Visual Thesaurus for Data Relationships": a lookup that maps a type of data relationship identified in a Work Domain Analysis to a display element suited to showing it. The chapter is the step that turns a work-domain model into concrete displays.
Body
Context
Burns & Hajdukiewicz (2004), in Ecological Interface Design, use Chapter 3 to establish the design language that the rest of the book relies on. The chapter examines how a designer moves from an abstract description of a work domain to the visual forms that display it, treating display design as a learnable craft rather than an intuition. It sits downstream of analysis in this knowledge base: Ecological Interface Design is the hub for the method, Work Domain Analysis supplies the relationships to be shown, and this chapter feeds the general shift toward meaning-carrying displays discussed in Representation Design.
Key Points
Interfaces as a nested hierarchy of designed objects. The chapter adapts Woods's (1997) hierarchy of interface objects — pixels, graphic atoms, graphic fragments, graphic forms, views, and the workspace — where each level is composed of and constrained by the level below it. Design decisions shift from elemental choices (colour, size, shape, position) at the lower levels to relational choices (salience, organisation, navigation) at the higher levels. Because adding an object changes how every other object is perceived, the design process is described as inherently cyclic (PDF pp. 82–84, orig. pp. 47–49).
Three forms of reference for data. Drawn from semiotics and applied to interfaces by Woods (1997), the three ways to refer to a datum are propositional, iconic, and analogical. Propositional forms (written and spoken language, alphanumerics) rely on learned, conventional symbols and so depend on the user's memory and literacy. Iconic forms look like the object they represent and evoke recognition rather than recollection, but depend on domain experience and on the designer building a form that genuinely resembles its referent — many so-called "icons" are actually propositional. Analogical forms capture an environmental constraint and map it onto the visual form, as a map preserves spatial relationships through scaling. No single form is best; effective interfaces use all three (PDF pp. 84–86, orig. pp. 49–51).
Analog versus digital graphic forms. Digital forms are alphanumeric and support precise reading at a point in time, but struggle to show context or history without adding coding. Analog forms are graphical and require a frame of reference — a background against which change and context become visible; they are strong for showing context and history but weak for precise reading. The two are often combined, for example a bar graph paired with a digital readout, to gain the benefits of both (PDF pp. 88–90, orig. pp. 53–55).
Context and salience. Context turns data into information by supplying background: whether a value is high, low, normal, abnormal, increasing, decreasing, or approaching a limit. A grade of 27 means something different out of 30 than out of 100. Salience is what "sticks out," governed by size, motion, flashing, and contrast with the background rather than by fixed colours; because salience is relative, it changes with every addition to a display, and it is the designer's means of controlling attention across an information-dense screen (PDF pp. 89–91, orig. pp. 54–56).
The Visual Thesaurus for Data Relationships. The chapter's organising device is a mapping from the type of relationship a display must convey to a generally effective visual form for it. Relationships are grouped as single-variable, multivariate, and structural. For single variables: a variable within limits suits a bar graph or meter (context) or a digital display (precision), a variable with a constraint suits the pie graph, a variable where normality matters suits a meter, symbol, or translating/rotating line, and a variable changing over time suits a trend chart or arrows. For multivariate relationships: balances suit connected bar graphs or trend charts, additive relations suit summing bar graphs, nomographs, or summing trend charts, multiplicative relations suit triangle graphics or nomographs, and multiple variables determining system state suit configural and polar displays, configural bar and line graphs, or mass data diagrams. For structural relationships: linear structures use lines and spirals, spatial structures use maps and matrices, and symbolic structures use trees, networks, and mimic diagrams. Each entry is stated with its best use and major limitation (PDF pp. 90–119, orig. pp. 55–84).
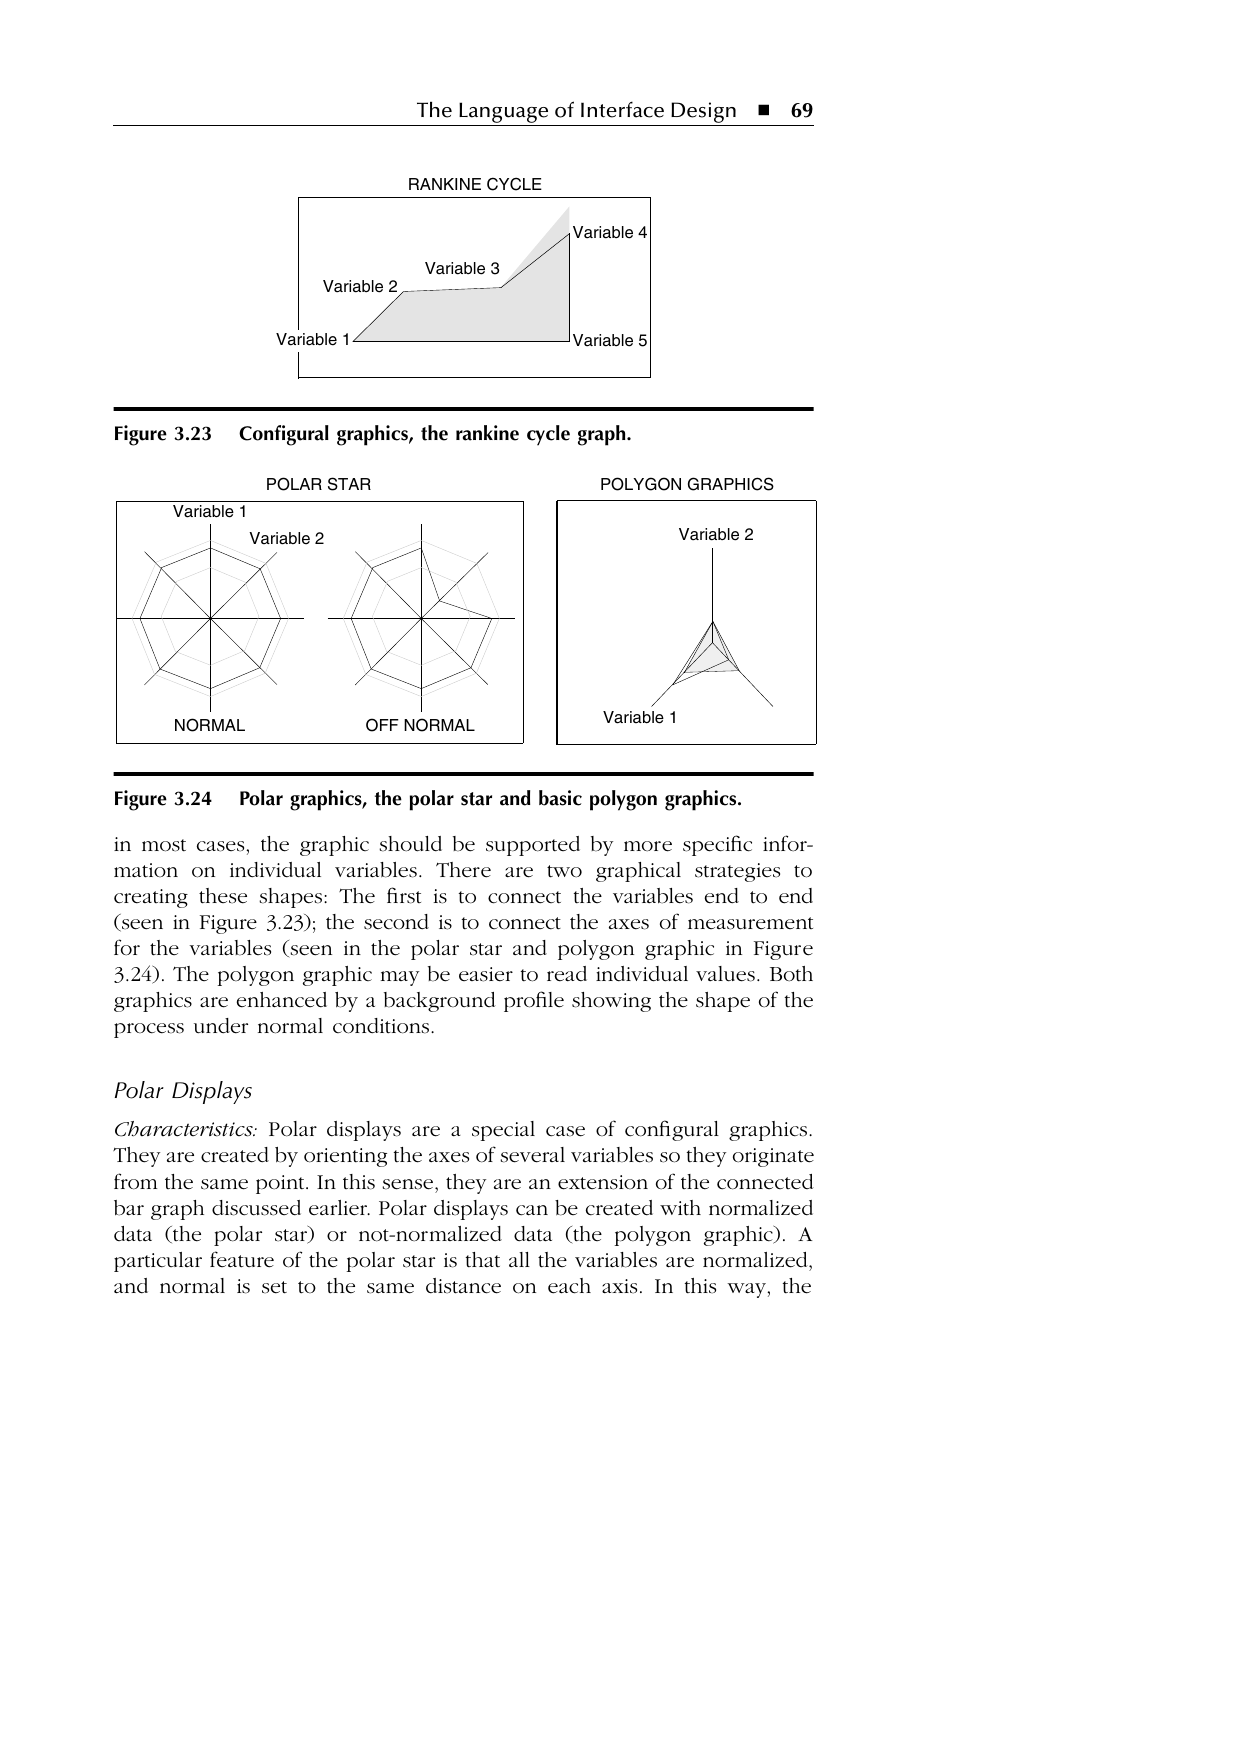
Configural and polar displays for system state. Configural displays plot several variables on a common background and connect them into a recognisable shape — either a form meaningful to the process (the rankine cycle graphic) or a familiar geometric shape (the polygon and polar star). Their purpose is a quick determination of overall system state from many variables, with normal conditions shown as a reference profile. The polar star normalises every variable so that a normal system forms a regular polygon and abnormal states form distinctive irregular ones; the polygon graphic does not normalise, so it can develop an emergent point toward a variable of concern. Both trade away precise value reading and time history and should be supplemented with detailed displays (PDF pp. 102–105, orig. pp. 67–70).
Developing new visual forms. The listed forms are examples, not an exhaustive set. The chapter offers heuristics for inventing forms: decide whether users need single or integrated values and exact or approximate readings; borrow plots from physics, biology, or medical textbooks (with Tufte, 1983, 1990, 1997 cited as sources of inspiration); and match the governing equation to a geometric shape so the display can carry the relationship directly (PDF pp. 116–119, orig. pp. 81–84).
Conclusion
The chapter supplies the connective tissue between analysis and display in ecological interface design. By naming the levels of an interface, the forms of reference, the analog/digital trade-offs, and above all a thesaurus that pairs data-relationship types with visual forms, it makes the translation from a work-domain model to a concrete display an explicit and repeatable design act rather than an intuitive leap.
Related
- Ecological Interface Design
- Work Domain Analysis
- Wda In Design
- Representation Design
- Data Visualization
- Perceptual Organization
References
Burns, C.M. & Hajdukiewicz, J.R. (2004) Ecological Interface Design. Boca Raton, FL: CRC Press. burns2004ecological
Dinadis, N. (2002) cited in Burns & Hajdukiewicz (2004) for the cross-hair balance display. To be validated
Tufte, E.R. (1983, 1990, 1997) cited in Burns & Hajdukiewicz (2004) as sources for relating information visually. To be validated
Woods, D.D. (1997) cited in Burns & Hajdukiewicz (2004) for the hierarchy of interface objects and the forms of reference. To be validated
Open Questions
- How well does the visual thesaurus, built for large fixed control-room displays, transfer to small-screen, touch, and interaction-rich interfaces?
- Which thesaurus mappings have empirical support for reducing operator error, and which rest on design reasoning alone?
- Where the same relationship admits several forms (for example configural bar graphs versus polar stars for system state), what selection criteria decide between them beyond "best use / major limitation"?