Ecological Interface Design in Telecommunications Systems
Status: emerging
Last updated: 2026-07-08
Sources: Burns Hajdukiewicz 2004 Ecological Interface Design.Pdf
Tags: [ecological-interface-design, telecommunications, network-monitoring, mass-data-display, work-domain-analysis, display-design, case-study]
Summary
Chapter 7 of Burns and Hajdukiewicz (2004) applies Ecological Interface Design (EID) to telecommunications systems through three case studies: two in computer-network management and one in aircraft radio communication. Unlike the process-control cases in the same book, these systems carry information rather than mass or energy, so the work domain analysis is built around the conservation and flow of information instead of physical conservation laws. The network-management case adapts the Part-Whole Decomposition to communication layers (application, network, data link, physical), derives information requirements at each abstraction level, and turns them into a three-dimensional display incorporating a mass data display overview, polar-star device graphics, and a link-utilisation matrix. Comparative evaluation against an industry tool (HP OpenView NNM) found the EID display slower for detection but faster and more accurate for diagnosis. The chapter also treats scalability and domain-boundary problems that are specific to networked information systems.
Body
Context
This article covers Chapter 7 of Burns, C.M. and Hajdukiewicz, J.R. (2004) Ecological Interface Design, which presents telecommunications as an EID application domain. It sits alongside the book's other domain case studies and extends the general method described in Ecological Interface Design and Work Domain Analysis to systems whose primary product is information flow rather than mass or energy transfer. The main worked example is a network-management project conducted with Nortel Networks using a portion of the University of Waterloo campus Ethernet (PDF p. 214, orig. p. 179; PDF p. 215, orig. p. 180).
Key Points
Why telecommunications systems break the usual mould. Burns and Hajdukiewicz (2004) note that telecommunications systems have software as well as physical components, scale almost without limit, and are built from many near-identical parts, so mass and energy models fit poorly and the system boundary is hard to fix (PDF p. 214, orig. p. 179). The organising principle for the analysis is therefore the flow of information: point-to-point in radio, and many-points-to-many-points in networks (PDF pp. 214–215, orig. pp. 179–180). Five recurring challenges frame the chapter: determining the system boundary, determining work domain analysis content, developing a diagnostic graphic for a low-capacity situation, using three-dimensional ecological displays, and developing visualisations that scale with large data volumes (PDF p. 215, orig. p. 180).
Adapting the Part-Whole Decomposition to communication layers. A first attempt to decompose the network along conventional network / subnet / device lines revealed little constraint differentiation, because networks look similar at every level of physical aggregation, merely larger (PDF pp. 215–216, orig. pp. 180–181). The analysis instead maps the Part-Whole Decomposition onto a communication-layer hierarchy — Application, Network, Data Link, and Physical layers. The lower three correspond directly to the OSI Reference Model, while the top layer collapses the OSI transport, session, presentation and application layers into a single end-user "Application Layer" (PDF p. 216, orig. p. 181). Using information aggregates rather than device aggregates yields a model that holds across networks of any size (PDF p. 216, orig. p. 181).
The abstraction hierarchy for network management. The five-level work domain model spans Functional Purpose (maximise throughput of communication between distributed applications; maximise availability and accuracy; minimise delay and errors), Abstract Function (information flow from sources to sinks, governed by a "conservation of information" principle whereby data must reach its intended sink without loss or misdirection), Generalized Function (traffic routing, segmentation, switching, error checking, signal generation and propagation, collision detection), Physical Function (routers, switches, bridges, hosts, network interface cards, cables), and Physical Form (network topology, physical location and condition of devices, port counts, cable type) (PDF pp. 216–219, orig. pp. 181–184).
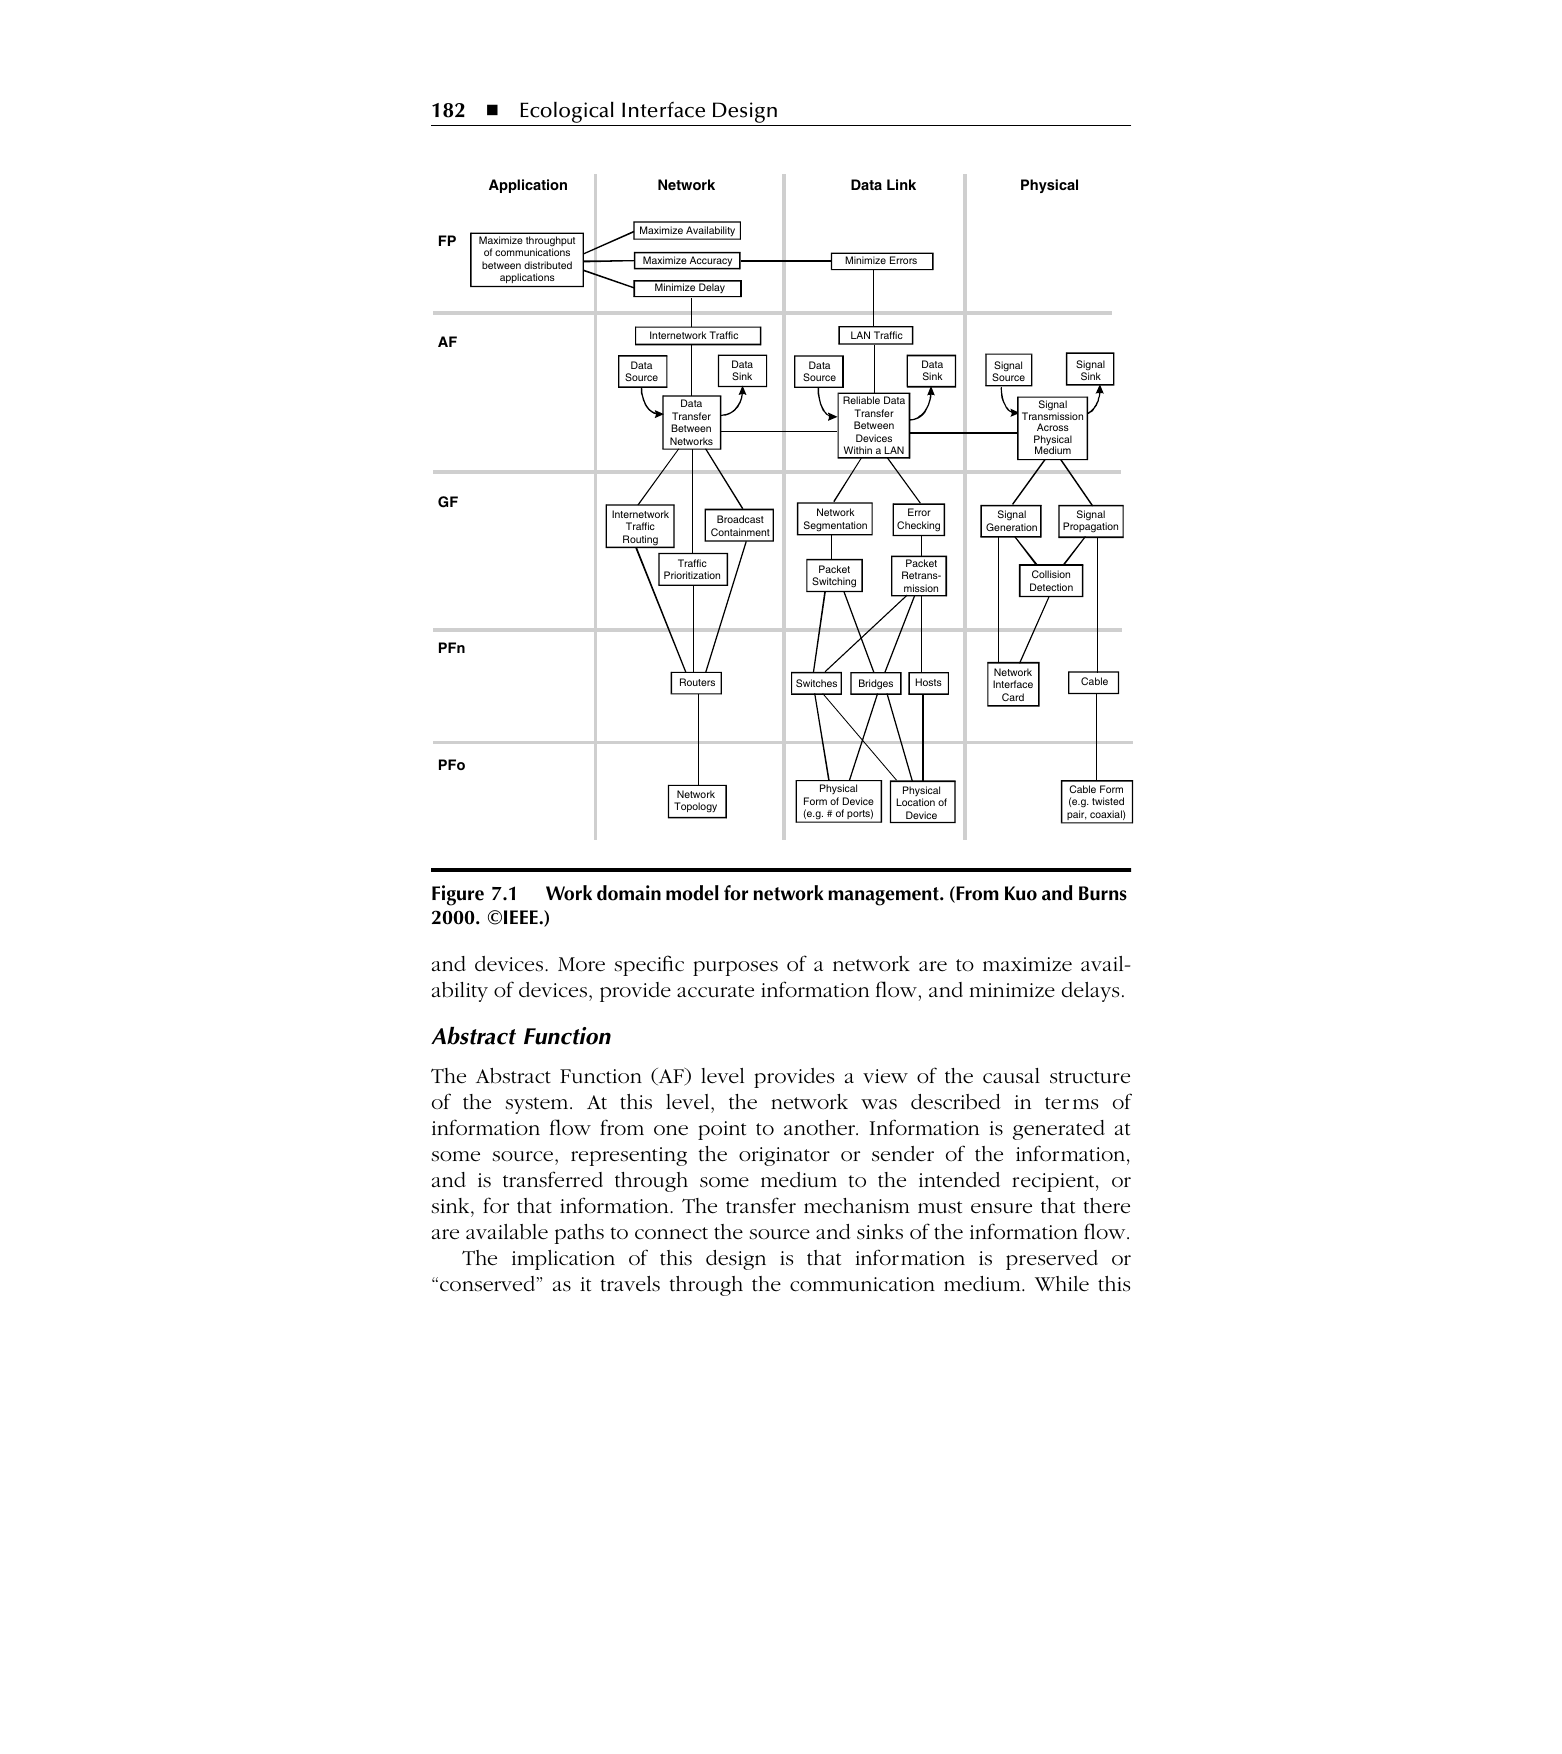
From requirements to displays, level by level. Information requirements were derived from each abstraction level and expressed as preliminary display requirements; no instrumentation availability analysis was performed (PDF p. 219, orig. p. 184). A working prototype was built in Visual C++ with OpenGL, driven by simulated data collected from the real network, producing a fully interactive three-dimensional environment for navigating and inspecting the network (PDF p. 220, orig. p. 185). Each abstraction level maps to a display element: the Functional Purpose overview, the Abstract Function link-utilisation view, the Generalized Function polygon metrics, the Physical Function device-info panel, and the Physical Form topological layout (PDF pp. 220–223, orig. pp. 185–188).
The Functional Purpose overview as a Mass Data Display. The overview is a two-dimensional topological map of every switch and router, each rendered as a coloured dot (green normal, yellow warning, red critical). This is an implementation of a Mass Data Display (MDD), a technique shown to support rapid fault detection by capitalising on human pattern recognition; a stacked trending bar graph beneath it sums devices in the Warning, Critical and Down states so overall network health reads off the bar height (PDF pp. 220–221, orig. pp. 185–186). The overview doubles as a navigation aid: selecting a point jumps the main three-dimensional view to that region (PDF p. 221, orig. p. 186).
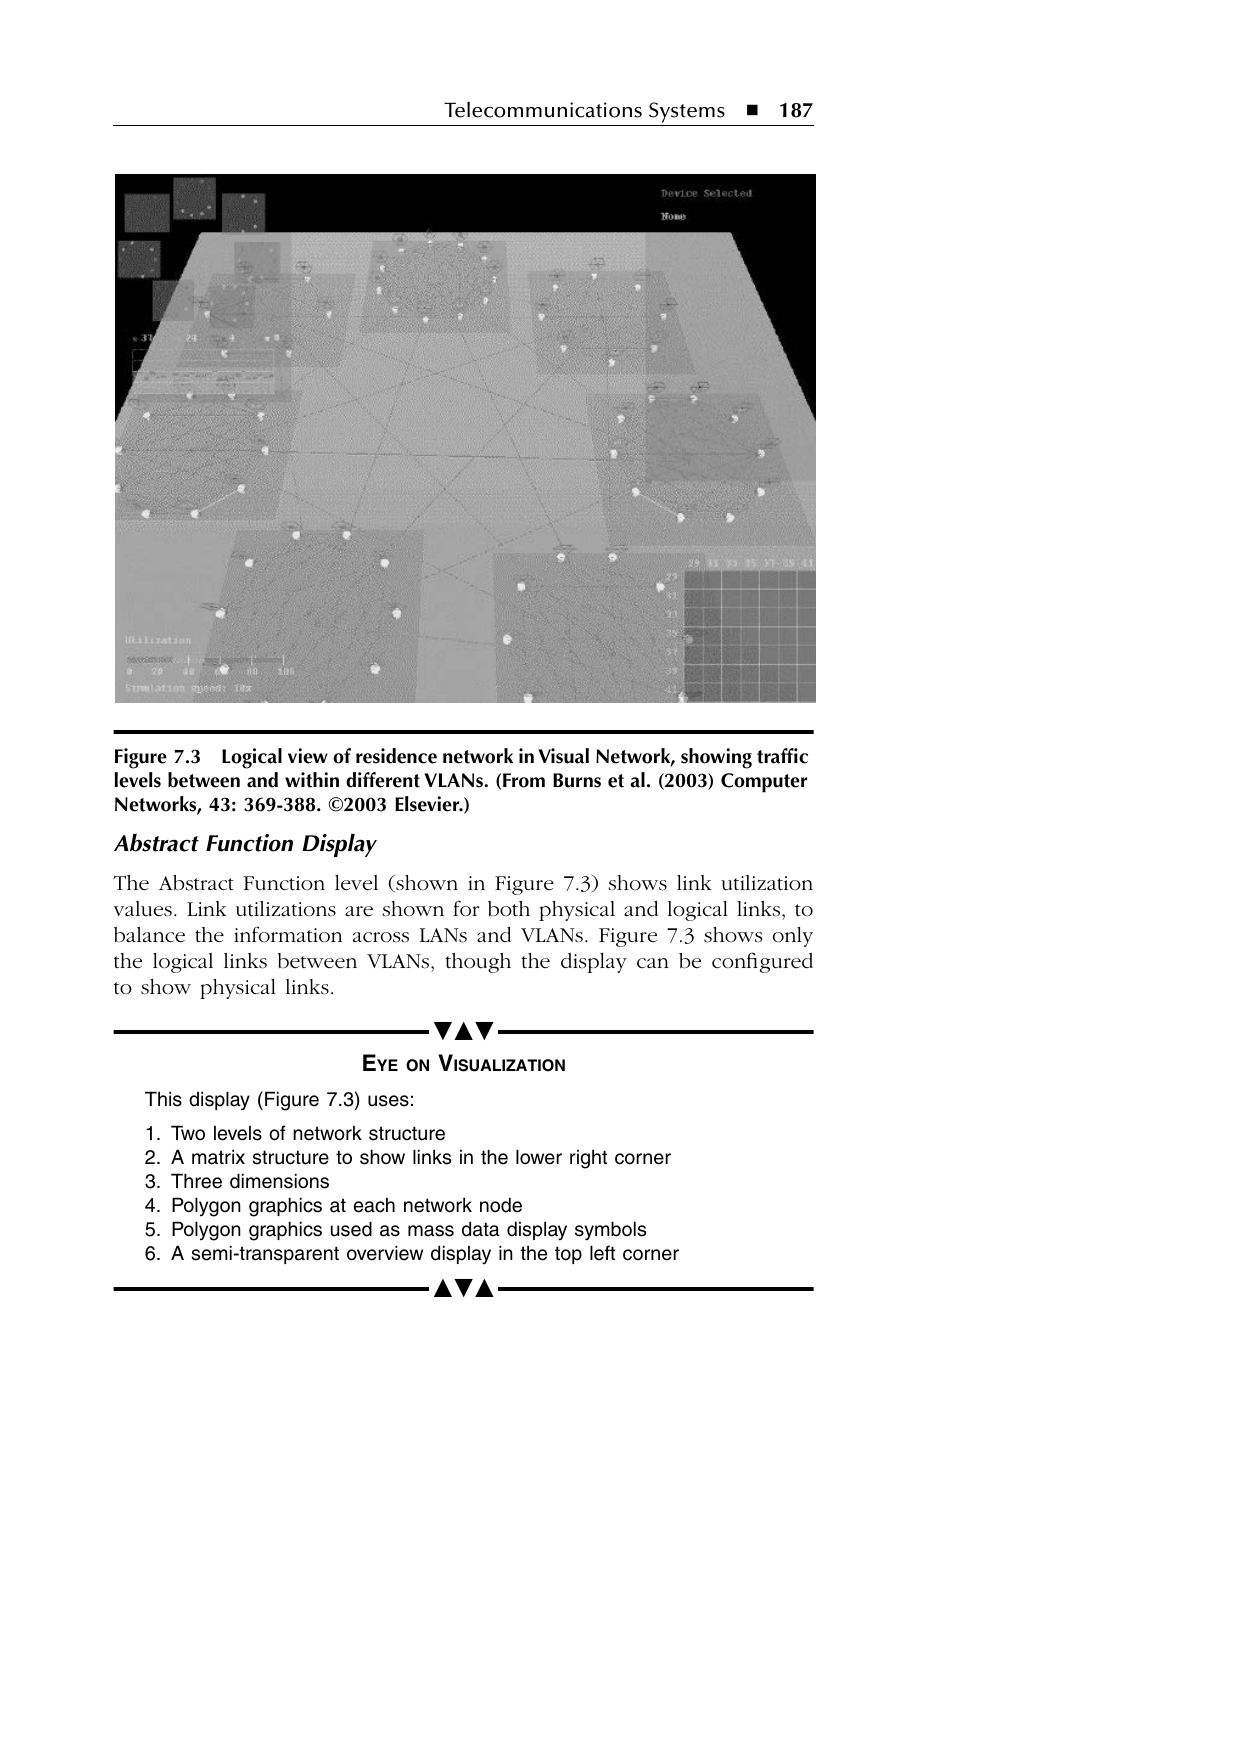
Link utilisation, polygon device graphics, and the utilisation matrix. At the Abstract Function level, links carry colour-coded utilisation (dull green when light, yellow past a warning threshold, red near saturation), and a lower-right matrix summarises combined bidirectional traffic between each pair of VLANs (PDF pp. 222–223, orig. pp. 187–188). At the Generalized Function level, six per-port metrics — broadcasts, multicasts, errors, packets, octets and utilisation, most read from RMON MIB variables — are plotted on a polar-star polygon above every device, whose emergent shape is read at a glance; a selected device also shows stacked detail graphs and a trending bar graph (PDF pp. 223–225, orig. pp. 188–190). The Physical Function panel gives device name, IP address, type and port count, repeating some Generalized Function data to reinforce the means-end link between levels (PDF pp. 224–225, orig. pp. 189–191). The Physical Form view arranges devices in their approximate real-world geographic positions inside labelled blue rectangles (one per building), with physical connection links drawn between devices to support fault tracing (PDF pp. 225–226, orig. pp. 191–193).
Evaluation against an industry tool. The prototype was compared with HP OpenView Network Node Manager (NNM) on detection and diagnosis tasks using captured university-network data. NNM produced faster detection times, but the EID display gave faster and more accurate diagnosis on all three diagnosis tasks. A limited field study with university network managers drew positive responses, especially toward the polar-star graphic, alongside concern about how the display would scale to larger networks (PDF p. 226, orig. p. 193).
An alternative design for scalability. A separate University of Toronto project (Duez and Vicente, submitted; Duez, 2003) applied work domain analysis to a full campus network and built a display around a hyperbolic tree, which magnifies the region of interest without fully hiding other nodes. Its top-left network-health view organises a Mass Data Display on the hyperbolic tree, and bar graphs and pie charts replace the polar-star graphic. The hyperbolic tree is presented as a better route to scaling the mass-data overview than the earlier fixed map (PDF pp. 226–228, orig. pp. 193–195).
The radio-communication case. Chéry et al. (1999) redesigned the Control Display Unit (CDU) interface of a CH-146 Griffon helicopter for radio communication, using an abstraction hierarchy with five constraint levels and one decomposition level. The Functional Purpose is to permit voice communication between remotely located parties; the Abstract Function draws on communication theory (entropy, channel, equivocation, encoder, decoder); the Generalized Function covers signal transduction, modulation, propagation and interference reduction; and the Physical Function lists microphone, antenna, ionosphere, filter and related components. The resulting display combines a coverage map, a Venn diagram of information transfer, process displays for attenuation and absorption, and per-channel signal information. It was assessed only by a cognitive walkthrough against a candidate alternative and has not been formally tested (PDF pp. 231–233, orig. pp. 196–198).
Handling the five challenges. The chapter closes by revisiting its framing challenges. System boundary was managed both by physically cutting the network at a main switch and, more generally, by shifting the Part-Whole Decomposition from device to information aggregation so the model holds across OSI-layered networks of any size (PDF pp. 229–230, orig. pp. 198–199). Work domain analysis content was resolved by modelling information flow, rather than mass or energy, at the Abstract Function level (PDF p. 230, orig. p. 199). For the low-capacity diagnostic graphic, the polar-star values were deliberately left un-normalised because network parameters should always be minimised; the polygon then loses its usual configural reading but gains an emergent spike whenever any value rises, which is diagnostic (PDF pp. 230–231, orig. pp. 199–200). The three-dimensional format let multiple abstraction levels sit on one topological base, at the cost of occlusion and turning information retrieval into a navigation task (PDF p. 231, orig. p. 200). Scalability was addressed by converting the main display into an overview of simple colour-changing symbols, most effectively via Duez's hyperbolic-tree Mass Data Display (PDF p. 231, orig. p. 200).
Conclusion
The telecommunications case studies demonstrate that EID transfers to information-carrying systems once the Abstract Function level is reframed around conservation and flow of information and the Part-Whole Decomposition is mapped onto communication layers rather than device aggregates. The network-management prototype shows that abstraction-hierarchy-driven displays — anchored by a Mass Data Display overview and integrated polar-star device graphics — can improve diagnostic speed and accuracy relative to a conventional tool, while the scalability and three-dimensional-occlusion trade-offs identify the main open engineering problems for the approach.
Related
References
Burns, C.M. & Hajdukiewicz, J.R. (2004) Ecological Interface Design. Boca Raton, FL: CRC Press. burns2004ecological
Burns, C.M., Kuo, J. & Ng, S. (2003) 'Ecological interface design: a new approach for visualizing network management', Computer Networks, 43, pp. 369–388. To be validated
Chéry, S., Vicente, K.J. & Farrell, P. (1999) 'Perceptual control theory and ecological interface design: lessons learned from the CDU', Proceedings of the 43rd Annual Meeting of the Human Factors and Ergonomics Society, pp. 389–393. To be validated
Duez, P.P. (2003) [Thesis on scalable network-management displays, University of Toronto; full citation to be confirmed]. To be validated
Duez, P.P. & Vicente, K.J. (submitted) [Paper on work domain analysis for full campus networks and scalable displays; publication details to be confirmed]. To be validated
Kuo, J. & Burns, C.M. (2000) '[Network-management work domain model]', ©IEEE. To be validated
Zinser, K. & Frischenschlager, F. (1994) '[Mass Data Display]'. To be validated
Open Questions
- How well does the polar-star device graphic and the fixed topological overview scale to networks of thousands of devices, given the positive but scale-cautious field responses (PDF p. 226, orig. p. 193)?
- Would the three-dimensional format's occlusion and navigation costs outweigh its multi-level integration benefit in operational use, and how would a two-dimensional or hyperbolic-tree variant compare directly (PDF p. 231, orig. p. 200)?
- The radio-communication CDU display was assessed only by cognitive walkthrough (Chéry et al., 1999); would formal performance testing confirm the predicted support for normal and abnormal operation (PDF p. 233, orig. p. 198)?